
resonance-frequency · hrv-science · journey-mode
The First Two Minutes: A Hidden Bias in How Resonance Frequency Is Measured
Max Frenzel, PhD · 25 July 2026 · 25 min read
Five years ago I ran a ten-day self-study to pin down my own resonance frequency. Twenty sessions, eight hours of data, sixteen breathing rates at a resolution of 0.1 breaths per minute. I wrote the whole thing up in Finding My Resonance Frequency. It was the origin of what would eventually become Yudemon's unique Journey mode.
Buried near the end of that article is a paragraph I have thought about a lot the last few weeks. I had deliberately randomised the order in which the rates were presented, because I suspected that I might simply relax as a session went on, and that the later rates would benefit unfairly. So I checked. And I wrote:
Surprisingly, there seems to be no clear correlation between order in the session and HRV, suggesting that the ordered progression used by most other protocols is actually justified and probably doesn't lead to any bias.
That conclusion was wrong. I now have 2,636 sessions from 195 people instead of 20 sessions from one person, and the effect I went looking for is not only there – for most people it is the single largest thing happening in the data.
This article is about what we found, why it matters beyond our own app, and what we have changed in response.
A one-minute refresher on resonance frequency
Slow breathing moves your heart rate. Breathe in and it speeds up; breathe out and it slows down. At one particular breathing rate – your resonance frequency – this oscillation gets dramatically larger, because the breathing rhythm lines up with a natural resonance in your cardiovascular system. (I explain the mechanism in How the Breath Controls the Heart.)
Training at that rate is what HRV biofeedback is. Most people land somewhere between 4.5 and 7 breaths per minute, and the difference matters: in my own data, moving just 0.2 breaths per minute away from my optimum costs me over 10% of my HRV response.
So how do you find it? Essentially every tool and clinic uses a version of the same protocol, laid out by Paul Lehrer, Evgeny Vaschillo and Bronya Vaschillo in their 2000 training manual and formalised since (Lehrer et al., 2013; Shaffer & Meehan, 2020). In Shaffer and Meehan's version you breathe at 6.5, then 6.0, then 5.5, then 5.0, then 4.5 breaths per minute, two minutes each. Whichever rate produces the biggest response wins.
Note the order. It is fixed in advance, and it descends.
Yudemon's Journey Mode works differently. Rather than deciding in one session, it spends ten minutes per session testing five rates in a narrow band around its current estimate, then updates that estimate and picks the next five. Over many sessions it converges. Crucially – and originally for the same vague suspicion I had in 2021 – it presents those five rates in a random order every single time.
That randomisation turned out to be the most valuable design decision in the whole system, for a reason I did not anticipate.
What the data says
Because the order is random, position within a session and breathing rate are statistically independent. That means we can separate them: we can ask what the response looks like as a function of where a segment fell in the session, with the effect of the actual breathing rate taken out, and vice versa.
Here is the result for HRV, measured as RMSSD, across every valid session in our database.
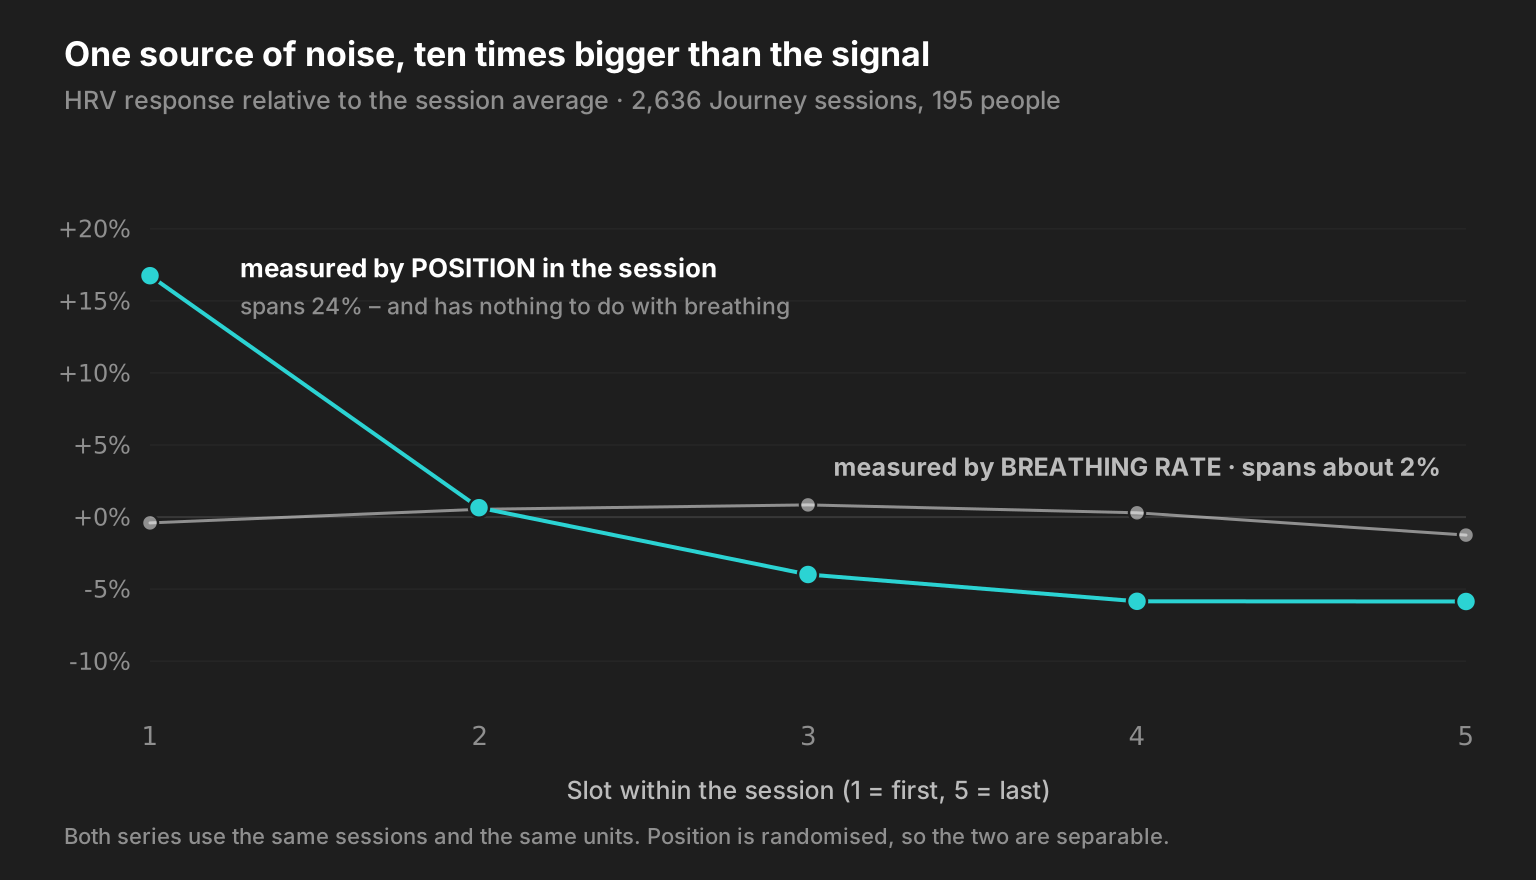
The cyan line is the thing we are not trying to measure. The grey line is the thing we are.
The first segment of a session comes in roughly 24% above the last one. The actual breathing rate – the entire point of the exercise – moves the same measurement by about 2%.
I want to be careful here, because that comparison flatters the finding. The rate effect looks tiny partly because a mature Journey deliberately tests rates that are very close together; by the twentieth session the five candidates might span just 0.25 breaths per minute, so of course the response differences are small. That is the whole design (and the accuracy other tools don't provide). But it is also exactly why the problem bites: the closer you zoom in on someone's true optimum, the more a positional artefact of this size dominates whatever real signal remains.
This is not a quirk of one metric. It's present across four (mostly) independent measures of the breathing–heart coupling – HRV, the size of the heart-rate swing on each breath, and two spectral metrics. All four show the same shape.
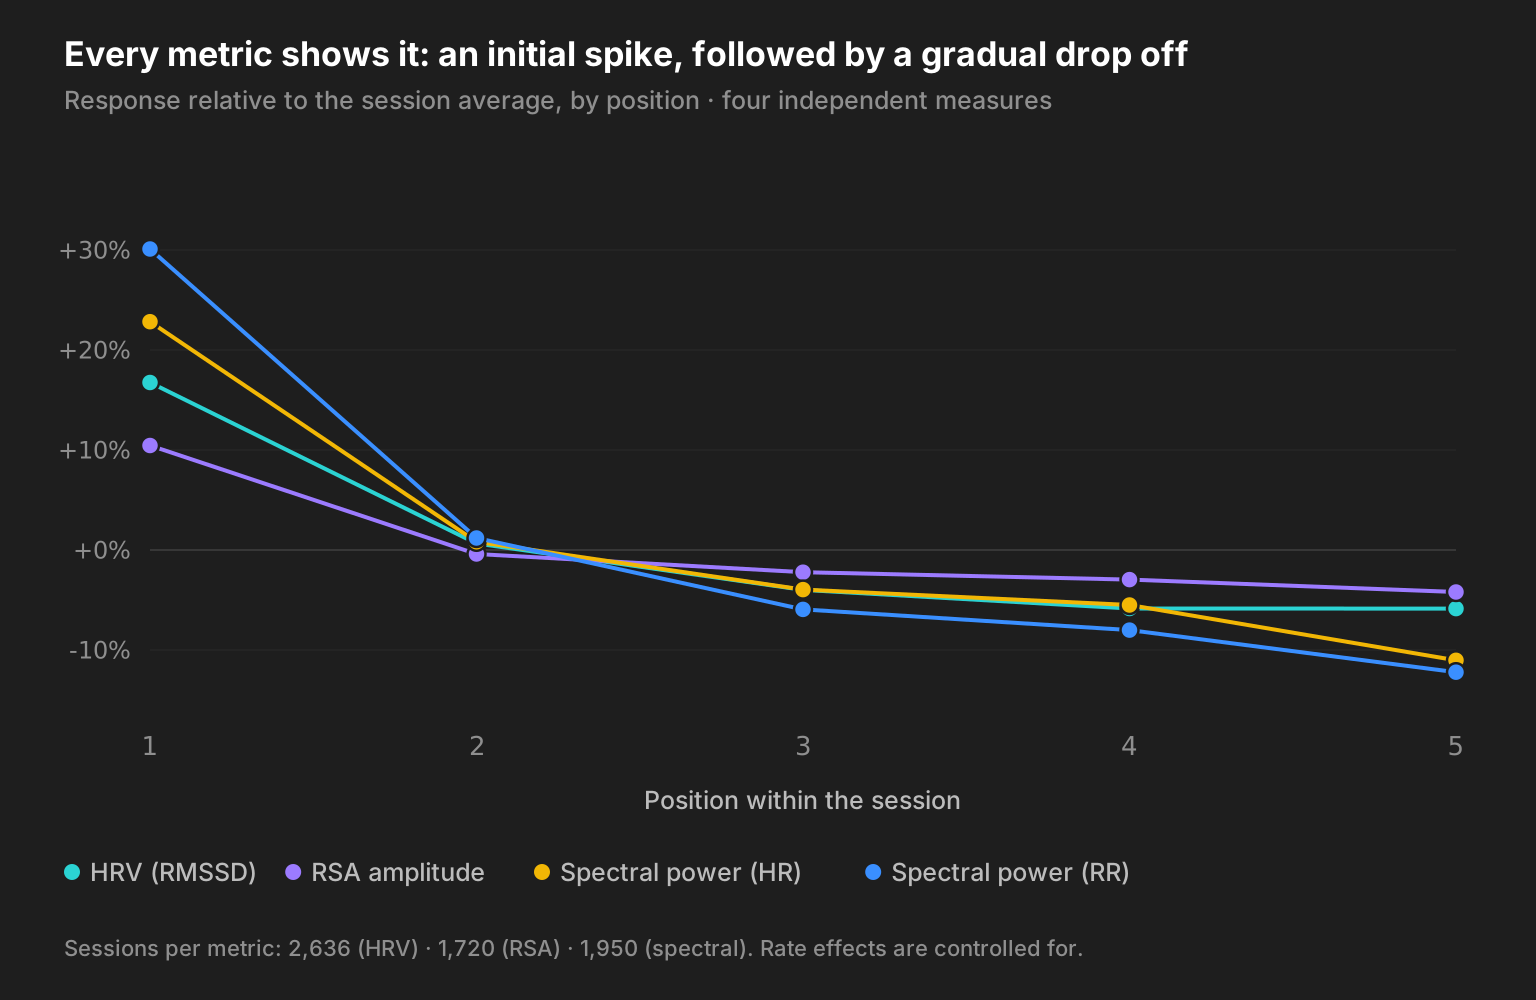
Notice the shape. It is not a smooth downward slope, which is what you would expect from gradually relaxing or gradually tiring. It is a large first segment, then a plateau. Whatever is happening, most of it happens in the first two minutes and then settles.
The spectral measures are hit hardest: spectral power of the RR series comes in 48% higher in the first segment than the last.
Almost everyone has it, and almost nobody has it equally
Restricting to the 77 people with at least ten valid Journey sessions – enough to say something about an individual rather than the crowd:
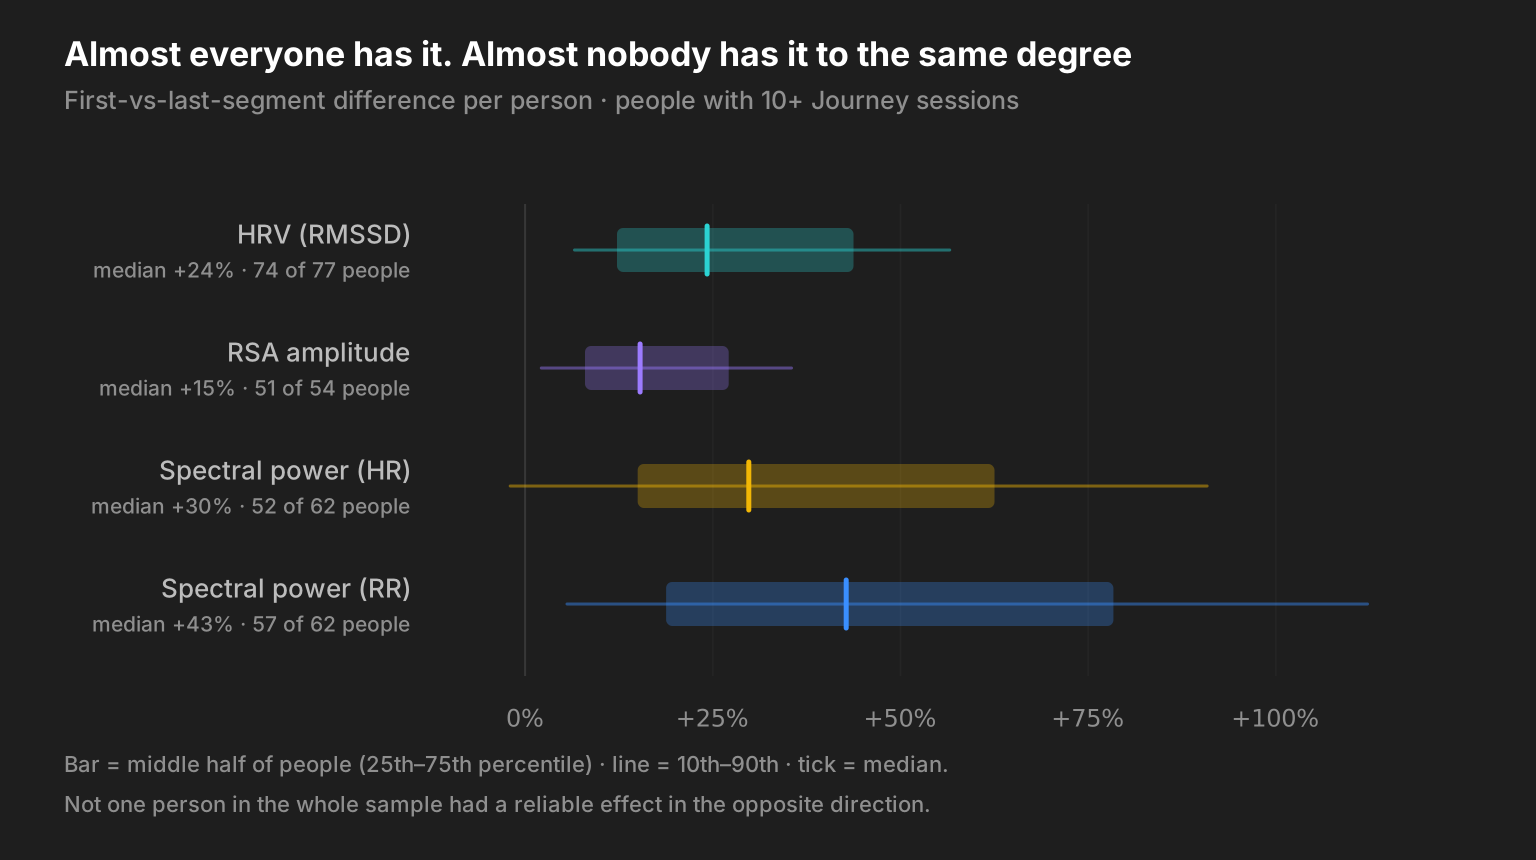
For HRV, 74 of those 77 people showed a higher first segment than last. Fifty-four of them showed it reliably. Not one person in the sample had a reliable effect in the opposite direction.
But the size is all over the place. The median person sits at +24%. The tenth percentile sits at +7%, the ninetieth at +57%. It is a common direction with a strongly individual magnitude.
This is also potentially why I missed it in 2021. When I ran my own numbers against the population model this week, my personal HRV effect came out at +9.7% – real, but less than half the median. I am a mild case who was looking for the effect in a single subject with twenty sessions. I had almost no chance of finding it, and I confidently reported its absence.
It is not a beginner's mistake
The obvious explanation is novelty: people are new to the exercise, and the first segment catches them still settling. So we split the data by how far into their Journey people were.
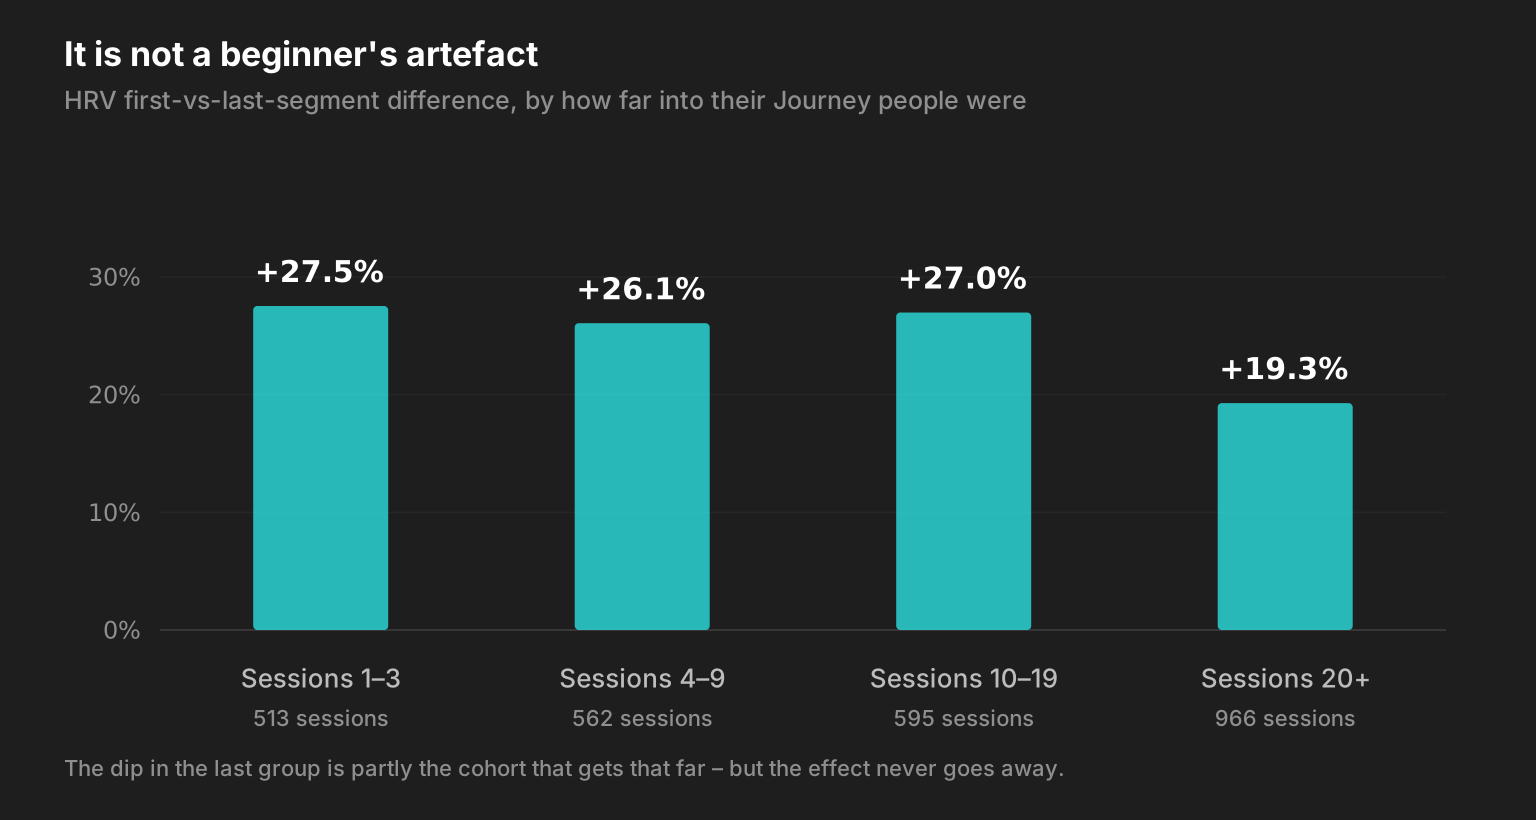
Someone on their fortieth session, who has done this exact ten-minute routine dozens of times, still shows most of the effect. The decline in the last group is real but modest, and partly reflects which people stick around that long. It does not go away.
It is not the rate changes either
One more objection, and it is the one that worried me most. Journey moves you to a new breathing rate every two minutes, and the first segment is the only one that is not preceded by a change. Perhaps I am not measuring position at all, but the disturbance of being switched to a new rate – which the first segment alone escapes.
There is a clean way to check. Yudemon's ordinary practice mode has no segments: you choose a rate and breathe at it for the whole session. We have 537 high-data-quality ten-minute sessions from 46 people where the rate never moved once. With no segment boundaries to average over, HRV can be followed continuously instead of in five lumps.
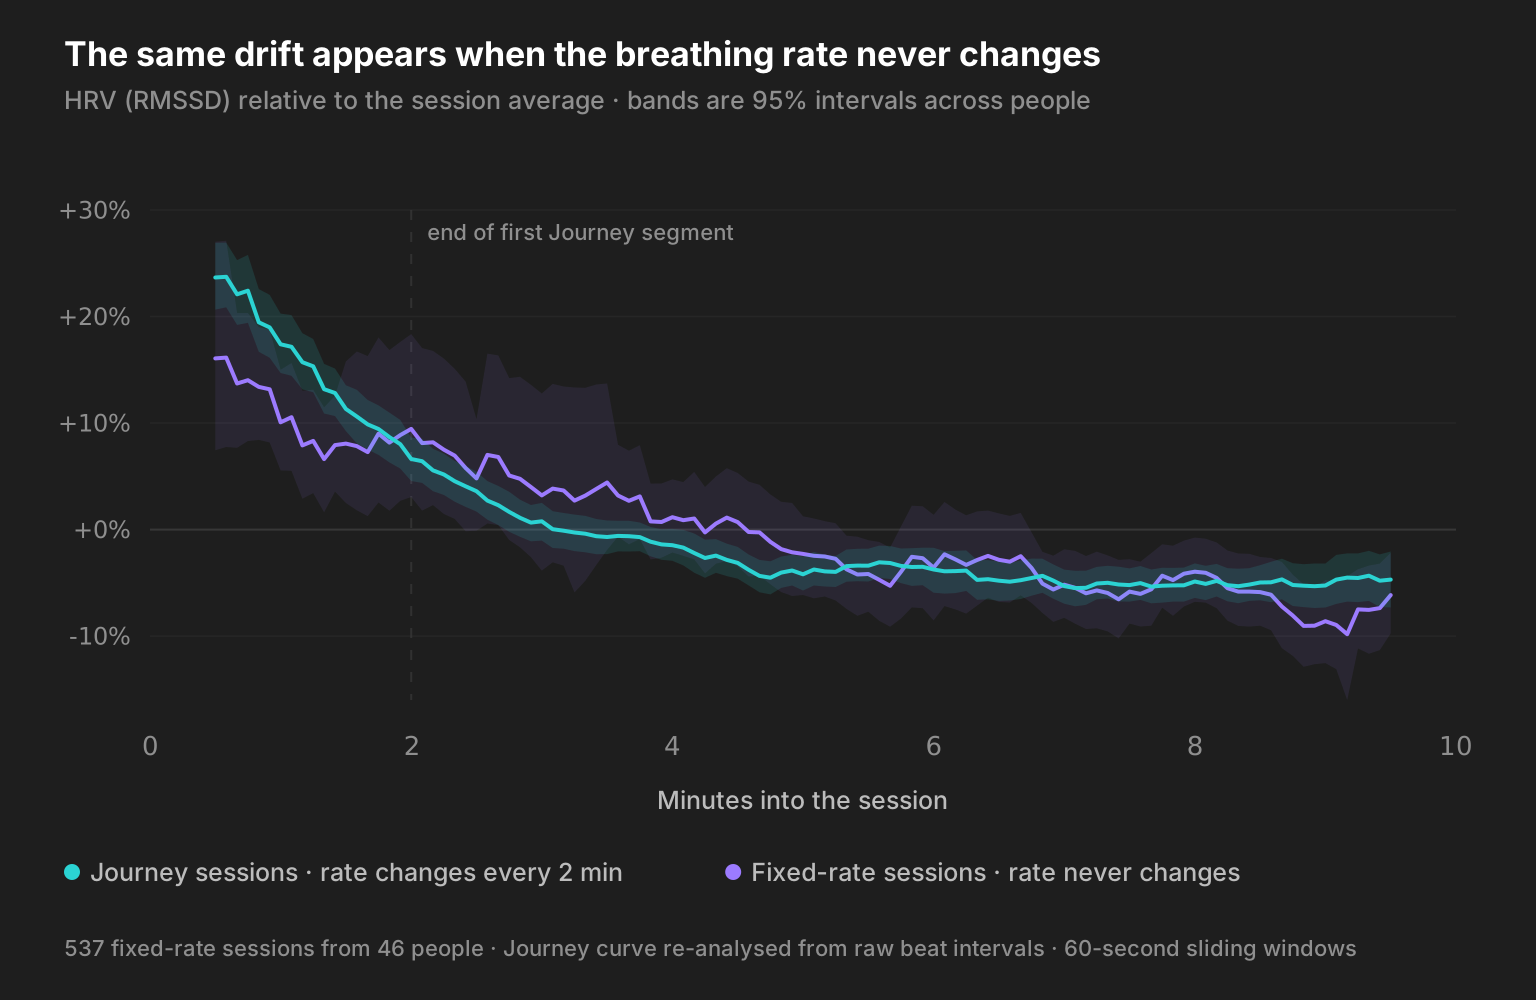
The two curves trace the same arc – the fixed-rate one more raggedly, because it rests on far fewer people. Fixed-rate sessions come in 18% higher on HRV in the first two minutes than the last two; Journey sessions, measured in exactly the same way, 21%. For the 41 people who do both, the gap between their two numbers is statistically indistinguishable from zero. Average heart rate meanwhile moves by about 1% – so this is not simply everything winding down together.
The continuous view also puts a clock on it. Half the drop is gone within about seventy seconds, and the curve does not truly level off until six or seven minutes in. The standard protocol gives each rate two to three minutes, which lands every trial squarely on the steepest part of that curve.
What might be causing it?
I want to separate what we measured from what we can explain. We measured the effect very clearly. The mechanism is a hypothesis.
I'll be honest that the direction surprised me. My gut instinct had always been the opposite – that people are a little restless at the start of a session, still finding the rhythm and not yet locked in, so the first two minutes would be the weakest. The data says the reverse: the first segment is reliably the strongest. Maybe people actually arrive most focused and drift as the ten minutes wear on – or maybe attention has little to do with it, and the cause is something more physiological.
The most convincing candidate is carbon dioxide. Sustained slow breathing tends to blow off more CO₂ than you produce. Szulczewski (2019) found that uninstructed breathing at 0.1 Hz (i.e. 6 breaths per minute) dropped end-tidal CO₂ by 5.21 mmHg, and that simply asking people not to over-breathe cut that drop to 2.7 mmHg. Low CO₂ is known to blunt respiratory sinus arrhythmia. A washout that reaches a new equilibrium after a couple of minutes and then holds would produce precisely the step-then-plateau shape we see.
Two other candidates are worth naming. An orienting response to the start of the task would inflate the first segment specifically. And simple settling – posture, sensor contact, attention – belongs in the same bucket. These are hard to distinguish with our data.
The effect is likely not a fatigue or time-on-task effect in the usual sense. The literature on that seems to point the other way: vagally mediated HRV tends to rise with time on task during mental fatigue, not fall (Matuz et al., 2021).
None of the underlying observations are entirely new. In 1996, Lehrer's group – Sargunaraj, Lehrer, Hochron, Rausch, Edelberg and Porges – had 24 volunteers do repeated five-minute trials of paced breathing, through a range of inspiratory resistive loads, and reported that “respiratory sinus arrhythmia (RSA) was elevated in the first minute of paced breathing, and then declined toward baseline.” They also found “evidence for hyperventilation and/or fatigue during paced breathing” – which is more or less the CO₂ story above. The phenomenon was already on the record 30 years ago, at a single breathing rate.
What appears to be genuinely absent is the connection between that observation and the validity of resonance frequency assessment. The 2000 training manual, the 2013 protocol paper, Shaffer and Meehan's 2020 practical guide, and Fisher and Lehrer's 2022 revision all test rates in an order fixed in advance, and neither they nor the 2023 systematic review and guidelines treat position as a source of bias. The closest anyone comes is the 2013 protocol, which warns that “the amplitude of HRV may change during a visit” and that this “may obscure detection of resonance frequency”. But it expects that drift to run upward, as the client relaxes into the session; its remedy is to re-test a few rates rather than to change the design; and nobody puts a number on it. Meanwhile, studies that compare breathing conditions routinely randomise or counterbalance their order precisely because everyone agrees order is a threat to validity – see for instance Meehan and Shaffer (2024), who both critique fixed-order designs in the slow-breathing literature and randomise their own.
The confound is well understood. It has just never been measured here.
Why this matters outside our app
In Yudemon's Journey, the order is random, so this effect is noise. In the standard protocol, the order is fixed, so the same effect becomes bias.
Take an imaginary person whose true response is genuinely flat – no real preference between 6.5 and 4.5 breaths per minute – and run them through the standard descending assessment. Apply nothing but the position effect we measured:
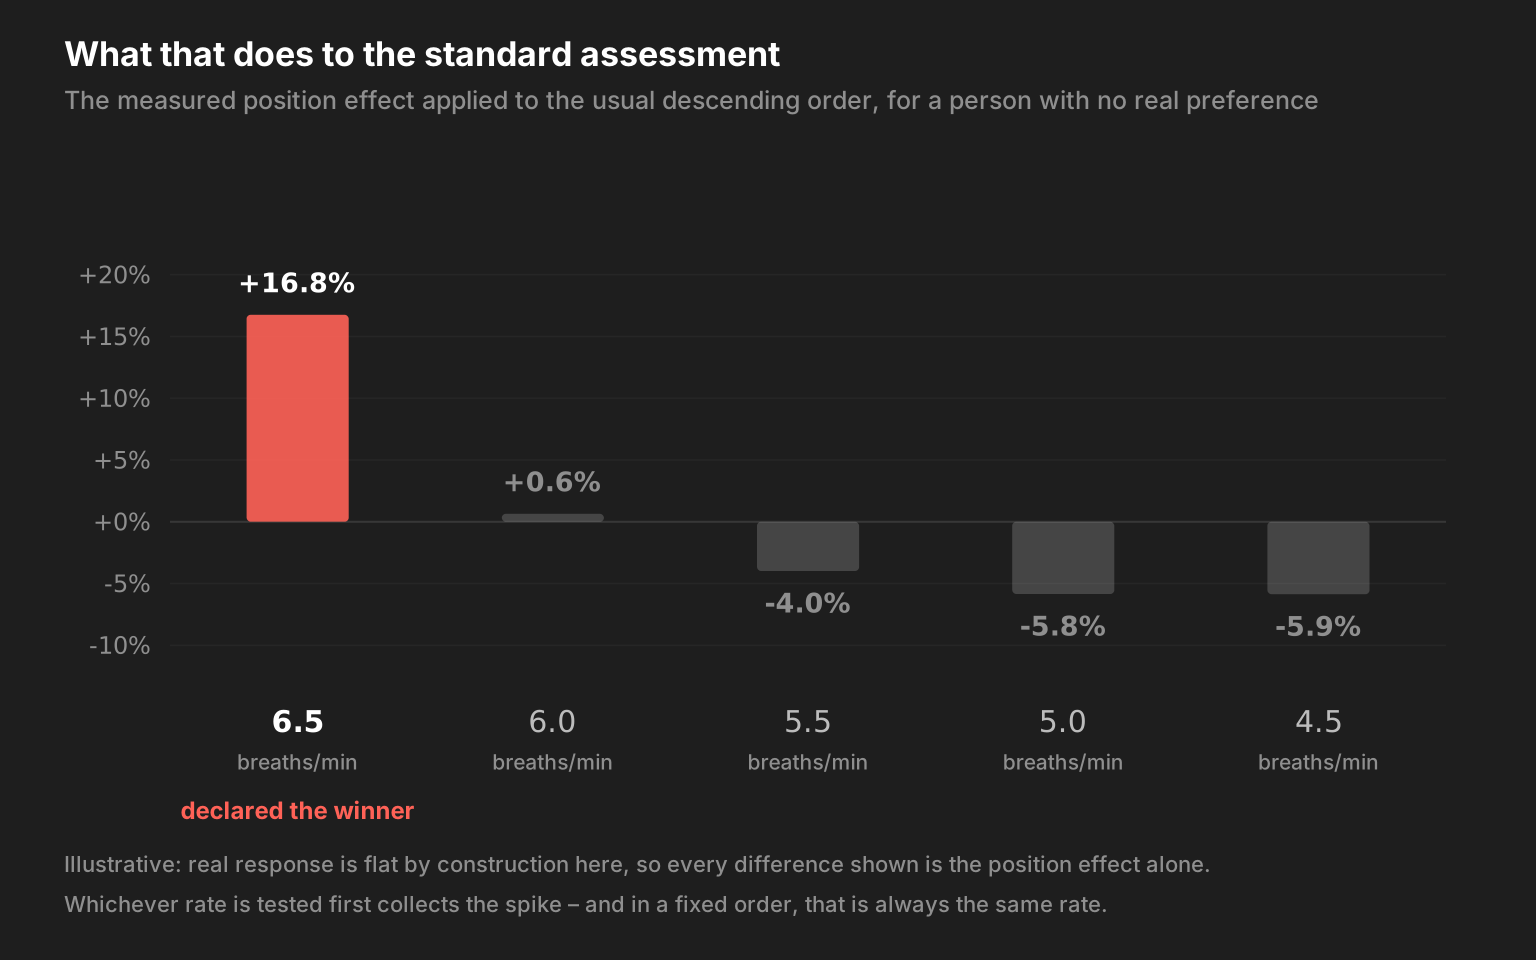
The assessment returns 6.5 breaths per minute with a comfortable margin, and every bit of that margin is an artefact of going first. In a fixed order, the rate tested first always collects the spike – and it is always the same rate.
Real people are not flat, so in practice this would not always flip the answer; a strong genuine peak at 5.0 can survive a 17% handicap. But it will pull estimates upward, it will decide close calls, and its size varies so much between individuals that you cannot correct for it with a single constant.
Some existing research makes these insights even sharper.
First, the one paper I found that specifically argues resonance frequency is unstable – Capdevila et al. (2021), who report that “RF changed between Test and Retest sessions in 66.7% of participants” – used a fixed descending order with no pauses between rates. That instability is exactly what you would expect from a protocol carrying an uncontrolled first-position bonus, and position is never considered as an explanation. Their conclusion is that resonance frequency should be reassessed before every single session. An alternative reading is that the assessment itself is noisier than it looks.
Second, Fisher and Lehrer's 2022 refinement replaces the five steps with a single continuous “sliding” sweep – 78 breath cycles between 4.25 and 6.75 breaths per minute, with breath duration changing by a fixed 67 ms each breath. It is a thoughtful improvement in most respects, and it does raise resolution well above 0.5 breaths per minute. But a continuous sweep has no stationary pacing window and no rest between rates at all, which gives within-session drift more room to act, not less.
I should flag the honest limits of the extrapolation, and there is one that matters. Our segments run back-to-back with no rest, while Shaffer and Meehan's version of the protocol inserts two-minute rests between trials. Those rests should help – they are exactly the washout a CO₂ explanation would call for – though the 1996 result, which used five-minute rests, suggests they do not eliminate the effect. How much washout there should be is itself unsettled: the sources above variously describe two-minute rests, three-minute stationary windows, and no pauses at all.
But that caveat applies to the careful clinical version of the protocol, and that is not what most people actually get. To my knowledge, among all consumer apps that offer to find your resonance frequency and run a real multi-rate sweep, not one fully-automated implementation uses the two-minute rest periods the clinical guide recommends. One inserts twenty to sixty seconds. The rest either state that the rates run continuously or say nothing at all. Segments are typically ninety seconds to two minutes, shorter than the research protocols. And all apps I'm aware of do a single downward sweep.
I could not find a single app, anywhere, that documents randomising the order or combining data across multiple sessions to establish your resonance frequency.
When I first had my own resonance frequency measured, in the app I described in Finding My Resonance Frequency, it was six minutes of continuous breathing stepping down from 7.5 to 5 breaths per minute, no pauses anywhere. The rate that went first collected the whole first-segment spike, and every rate after it was measured on a body that had already been slow-breathing for minutes. That assessment told me 5.5. Everything I have measured since puts me around 5.35.
That is the differentiator, and it is worth saying plainly: randomised order is the entire reason this effect was visible to us and invisible to everyone else. It was not cleverness – it was a hunch I had in 2021 and then talked myself out of. It just happened to be the one design choice that made the confound measurable.
One more piece of honesty: Lehrer's protocol weights the phase relationship between heart rate and breathing above raw amplitude, which is plausibly more robust to this than the amplitude and power criteria are. But peak-to-trough amplitude and low-frequency power are also on that list, they are what the automated tools mostly use, and they are precisely the quantities our data shows to be positionally inflated.
| Standard assessment | Yudemon Journey | |
|---|---|---|
| Duration | One session, ~10–20 min | Ten minutes per session, ongoing |
| Rates tested | 6.5 → 4.5, steps of 0.5 | Five fine-tuned rates per session around the current estimate |
| Order | Fixed, descending | Randomised every session |
| Resolution | 0.5 breaths/min | Converges to arbitrary precision |
| Position effect | Uncontrolled, biases toward the first rate | Randomised, and now measured and removed |
| Result | A single rough number from one sitting | A precise estimate that sharpens with every session |
So what is a normal resonance frequency?
Most people who have heard of “resonance frequency” have probably also heard the claim that the average one is at about 6 breaths per minute, or 0.1 Hz. I thought this too – and have said it myself – until I looked into the data and research for this article.
Compared to that claim, our users' estimates have always looked low to me. Yudemon practitioners simply do not look like that. So I went and checked both halves of the claim properly.
Where “6 breaths per minute” comes from. It is not a population average. It is a property of the baroreflex loop: if the delay in the loop is D seconds, the loop resonates at 1/(2D) Hz, and a five-second delay gives you 0.1 Hz. The empirical anchor is Vaschillo et al. (2002), who drove the cardiovascular system at a range of frequencies and found loop delays of 4–6.5 seconds – in five healthy men. “About 6 breaths per minute” is a rounded theoretical constant that hardened into a fact through repetition.
What the literature actually measured. The field's most-cited rate-sweep distribution study is Vaschillo, Vaschillo and Lehrer (2006), 56 adults assessed across ten sessions each. Their reported mean resonance frequency is 5.56 breaths per minute, standard deviation 0.41, range 4.5–6.5. Not six. The number the field measured and the number the field quotes have been about half a breath apart for twenty years.
What we see. Among our 77 people with ten or more sessions, the median estimate is 5.75 breaths per minute (95% confidence interval 5.62 to 5.83 – it excludes 6.0), and 78% sit below six.
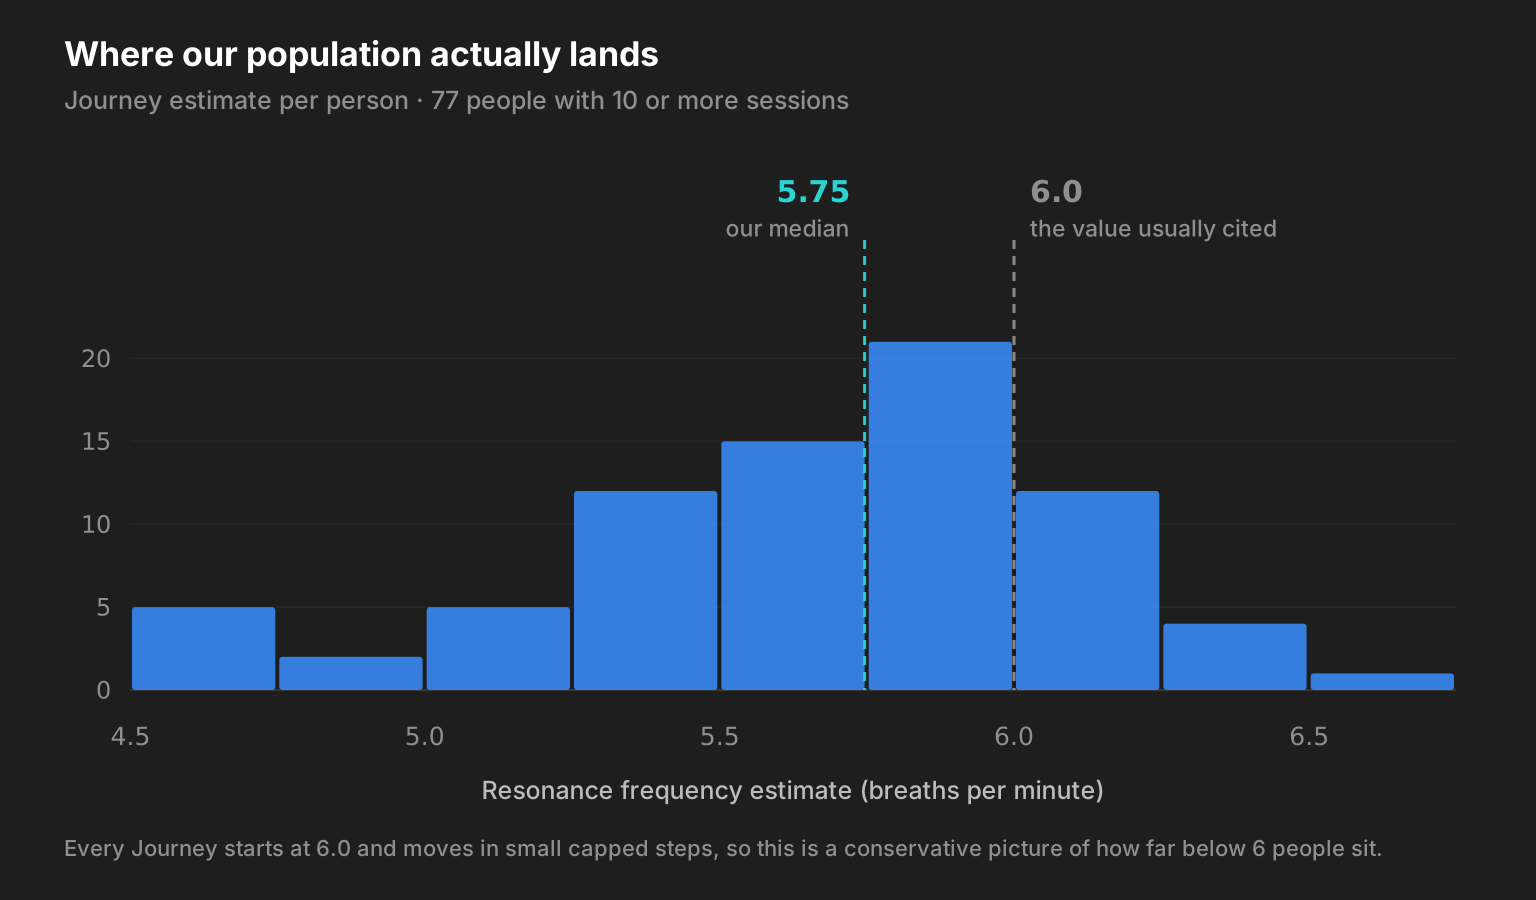
So the honest headline is not that we have overturned anything. It is that a consumer app with randomised presentation order, measuring continuously over months, lands in essentially the same place as a 2006 laboratory study – and both land below the figure that gets repeated everywhere.
Three things make me take our number seriously, and one makes me hold it loosely.
It is a ceiling, not a point estimate. Every Journey starts at 6.0 and moves in small capped steps, so our estimates are dragged toward six by construction. Among people who reached twenty sessions, the same individuals drifted from a median of 5.83 at session ten down to 5.62 by their last one, and past forty sessions the median is 5.39. Whatever the true population median is, it is probably below what we can currently see.
It is not survivorship. The obvious objection is that people with low resonance frequencies simply stick with the app longer. They do not: the correlation between someone's estimate at session ten and how many sessions they went on to complete is essentially zero (Spearman −0.10, p = 0.38).
It is not the algorithm's thumb on the scale. Journey samples symmetrically around its current estimate. Nothing in it pushes people down.
But there is a grid problem that cuts both ways. Reported resonance frequencies are bounded by whichever rates the experimenter chose to test. Vaschillo's grid ran 4.5–6.5 and produced a mean of 5.56. Capdevila et al. (2021) tested 5.0–7.0 and got about 6.0. Hasuo et al. (2024) also tested 5.0–7.0, and 24% of their healthy participants landed exactly on 7.0 – the highest rate available, which means their real optimum could be anywhere above it. Move the grid, move the answer. Journey has no grid at all, which is a genuine advantage, but it does have that 6.0 starting point, which is a different kind of anchor (that gets less relevant the more Journey sessions someone does).
Does the position effect explain the gap? Partly, at most, and I want to be careful here. A fixed descending protocol hands its first-segment bonus to the highest rate tested, which would inflate published estimates – including Vaschillo's own 5.56. That is a coherent story, and it suggests the true value sits below both their number and ours. But it is a prediction, not a finding. The larger part of the “six breaths per minute” discrepancy is much more boring: the popular figure was never a real measurement in the first place, just a convenient round number that got shared.
One genuinely useful thing does come out of the literature here. The best-established predictor of an individual's resonance frequency is height – the 2006 study found a correlation of −0.55 with height, averaged across its ten sessions, and none at all with weight or age. Taller body, more vasculature, longer baroreflex delay, lower resonance frequency. Hasuo's group turned height and sex into a rule of thumb that explains about half the variance. If your resonance frequency comes out well below six, the least exotic explanation is that you are tall.
I would love to have tested that here, and I cannot – which is my own fault. Yudemon has always let you optionally share a few details in your account settings, and I picked the obvious ones years ago: birthday, gender, weight. Not height. So the single body measurement with real published evidence behind it is the one we never asked for, and every user who generously filled that form in gave us mostly fields that do not predict resonance frequency. Checking our own data against Vaschillo's height finding is simply not possible.
I have now added an optional height field to the account settings, which fixes it going forward but does nothing for the analysis in this article. So: if you use Yudemon and you do not mind, please open your account settings and add your height. It takes about ten seconds, it stays optional, and it is the one thing that would let a few hundred ordinary people test a relationship that has so far only been examined in samples of 56 and 154. If enough people do it, I will write up what we find.
And the caveat that governs this whole section: we are a consumer app, not a study. Our users chose themselves, only a minority have shared any personal details at all, we know nothing about anyone's health or fitness, nobody supervised a single session, and we cannot verify that anyone actually followed the pacer. I am a theoretical physicist and AI researcher by training, not a physiologist, and the people whose work I am citing have spent careers on this. I am not proposing a new population value for resonance frequency. I am reporting that when you measure a few hundred ordinary people, repeatedly, in a random order, you get numbers that sit close to what the original laboratory work found – and comfortably below what is usually quoted.
What this means if you already have a Journey
Short version: your results were fine, and nothing you have done needs redoing.
The longer version is worth understanding, because it is the difference between noise and bias. A biased measurement is wrong in a consistent direction, and collecting more of it makes you more confident in the wrong answer. A noisy measurement is wrong in a random direction, and collecting more of it averages the error away.
Because Journey has always randomised the presentation order, the first-segment spike landed on a different rate every session. Over a Journey of any length, it cancels. It was never pushing your estimate anywhere in particular – it was adding scatter, which is why estimates wobble session to session and why it takes several sessions before things settle down.
So: existing estimates are valid, and the ones built on many sessions are genuinely trustworthy. What changes is efficiency. Removing a large source of random error means each session carries more information, so estimates should settle faster and sit more steadily once they get there.
I checked this on my own Journey too. My current estimate is 5.363 breaths per minute. Re-analysing all 75 of my sessions from scratch, with the position effect removed, my HRV response curve peaks at 5.366, and the three other metrics land between 5.349 and 5.358. Run the same analysis with no correction at all and the peak sits at 5.383.
That is reassuring in both directions. The correction moves my answer by 0.017 breaths per minute – so it is not manufacturing a new result – and every version of the analysis agrees with the 5.3 to 5.4 range I established independently in 2021 with eight hours of fine-grained data. The algorithm was finding the right answer. It was just working harder than it needed to.
What we changed
Journey Mode has a new estimator, which shipped in app version 2.16 on iOS and Android. Without getting into the internals, it does three things differently.
It learns how susceptible you personally are. Since the size of the effect varies so much between people, a single population correction would help most users and actively harm the ones like me who barely have it. So the estimator builds a picture of your own drift from your own completed sessions, starts conservative when it has little history, and never uses the session it is currently scoring to correct that same session.
It explores more deliberately. New Journeys start with a wider spread of candidate rates, which narrows faster as evidence accumulates. And when your responses repeatedly peak at the edge of the tested range, the next session reaches further in that direction, rather than widening at random intervals as before.
And it is fully backwards compatible. No data is rewritten, no Journey is reset, no estimate is retroactively changed. Every raw measurement your app has ever recorded stays exactly as recorded. Your history simply starts informing your future estimates. If you have 40 sessions behind you, the new estimator has 40 sessions of your personal physiology to work with from the first session you complete after updating.
What this does and does not prove
I would rather understate this than oversell it.
We have shown that presentation position is a large, reliable, individually varying source of variation in every metric used to assess resonance frequency, that it persists in experienced practitioners, and that it is randomised in our data and fixed in the standard protocol. That much I am confident in, and the random assignment makes it unusually strong evidence for observational data.
We have not shown that anyone's resonance frequency is a specific number. There is no independent ground truth for resonance frequency in app data – no gold-standard measurement to check against – so what we can honestly claim is that we have removed a repeatable source of error from the estimate, not that we have proven the estimate correct. We also cannot verify how well people actually followed the breathing pacer, and we cannot measure CO₂, so the mechanism stays a hypothesis.
And this is one dataset, from one app, with one segment structure. I would very much like to see whether it replicates in a lab, with capnography, with rest periods between trials, and with the order deliberately reversed for half the participants. That experiment is straightforward, and I do not think anyone has run it.
If you are a researcher in this area and that sounds interesting, I would love to hear from you. And if you practise HRV biofeedback seriously and have had your resonance frequency measured more than once with different answers each time – that is not necessarily your physiology being fickle. It may be that the first thing you were asked to do had an unfair advantage.
If you want to find your own resonance frequency this way, Journey Mode is part of the Yudemon HRV app on iOS and Android.
References
Vaschillo, E., Lehrer, P., Rishe, N., & Konstantinov, M. (2002). Heart rate variability biofeedback as a method for assessing baroreflex function: a preliminary study of resonance in the cardiovascular system. Applied Psychophysiology and Biofeedback, 27(1), 1–27. doi:10.1023/A:1014587304314
Vaschillo, E. G., Vaschillo, B., & Lehrer, P. M. (2006). Characteristics of resonance in heart rate variability stimulated by biofeedback. Applied Psychophysiology and Biofeedback, 31(2), 129–142. doi:10.1007/s10484-006-9009-3
Hasuo, H., Mori, K., Matsuoka, H., Sakuma, H., & Ishikawa, H. (2024). An estimation formula for resonance frequency using sex and height for healthy individuals and patients with incurable cancers. Applied Psychophysiology and Biofeedback, 49(1), 125–132. doi:10.1007/s10484-023-09602-5
Lehrer, P. M., Vaschillo, E., & Vaschillo, B. (2000). Resonant frequency biofeedback training to increase cardiac variability: rationale and manual for training. Applied Psychophysiology and Biofeedback, 25(3), 177–191. doi:10.1023/A:1009554825745
Lehrer, P., Vaschillo, B., Zucker, T., Graves, J., Katsamanis, M., Aviles, M., & Wamboldt, F. (2013). Protocol for heart rate variability biofeedback training. Biofeedback, 41(3), 98–109. doi:10.5298/1081-5937-41.3.08
Shaffer, F., & Meehan, Z. M. (2020). A practical guide to resonance frequency assessment for heart rate variability biofeedback. Frontiers in Neuroscience, 14, 570400. doi:10.3389/fnins.2020.570400
Sargunaraj, D., Lehrer, P. M., Hochron, S. M., Rausch, L., Edelberg, R., & Porges, S. W. (1996). Cardiac rhythm effects of .125-Hz paced breathing through a resistive load: implications for paced breathing therapy and the polyvagal theory. Biofeedback and Self-Regulation, 21(2), 131–147. doi:10.1007/BF02284692
Capdevila, L., Parrado, E., Ramos-Castro, J., Zapata-Lamana, R., & Lalanza, J. F. (2021). Resonance frequency is not always stable over time and could be related to the inter-beat interval. Scientific Reports, 11, 8400. doi:10.1038/s41598-021-87867-8
Fisher, L. R., & Lehrer, P. M. (2022). A method for more accurate determination of resonance frequency of the cardiovascular system, and evaluation of a program to perform it. Applied Psychophysiology and Biofeedback, 47(1), 17–26. doi:10.1007/s10484-021-09524-0
Lalanza, J. F., Lorente, S., Bullich, R., García, C., Losilla, J.-M., & Capdevila, L. (2023). Methods for heart rate variability biofeedback (HRVB): a systematic review and guidelines. Applied Psychophysiology and Biofeedback, 48(3), 275–297. doi:10.1007/s10484-023-09582-6
Szulczewski, M. T. (2019). An anti-hyperventilation instruction decreases the drop in end-tidal CO₂ and symptoms of hyperventilation during breathing at 0.1 Hz. Applied Psychophysiology and Biofeedback, 44(3), 247–256. doi:10.1007/s10484-019-09438-y
Meehan, Z. M., & Shaffer, F. (2024). Do longer exhalations increase HRV during slow-paced breathing? Applied Psychophysiology and Biofeedback, 49(3), 407–417. doi:10.1007/s10484-024-09637-2
Matuz, A., van der Linden, D., Kisander, Z., Hernádi, I., Karádi, K., & Csathó, Á. (2021). Enhanced cardiac vagal tone in mental fatigue: analysis of heart rate variability in time-on-task, recovery, and reactivity. PLOS ONE, 16(3), e0238670. doi:10.1371/journal.pone.0238670
Analysis based on the Yudemon production database as of 25 July 2026, covering 2,636 Journey sessions from 195 people, plus 537 ten-minute fixed-rate sessions from 46 people. All population figures in this article are aggregate statistics; no individual records were exported, and the only personal data shown is my own.
For a current overview of the practice, see the guide Resonance Breathing: How to Do It and What the Research Shows.