
apexflow
One iRacing Season, Two Series, and 155,256 Heartbeats
Max Frenzel, PhD · 9 September 2026 · 19 min read
Many of the things I build come from curiosity about myself, and self-experimentation has turned out to be one of my most useful product development tools. The original Yudemon HRV app grew out of a ten-day experiment to pin down my own optimal breating rate, and most of what the app does today started life as a question I wanted answered about my own physiology.
ApexFlow is the same idea in a very different setting. I built it because I wanted to know what actually happens inside me when I race. But building the tool is only half of it. So for the whole of iRacing's 2026 Season 3 I wore a heart rate strap for every test, practice, qualifying and race session in two different series, and let ApexFlow record and align every heartbeat with the car's telemetry, simply to see what I would find. This article is what came out of that: one season of sim racing, seen through my physiology.
The setup
For the full iRacing 2026 Season 3 I completed at least one race each week in the following two series:
- Production Car Challenge (PCC) – Toyota GR86 (a car I've driven on track in the real world), a multi-class field, rolling starts, 25-minute races
- FIA Formula 4 Challenge (Fixed) – FIA F4, single class, standing starts, 15-minute races
On the physiology side, a Polar H10 chest strap records the exact time of every heartbeat, and ApexFlow records and aligns that with the iRacing telemetry at ten samples per second: speed, brake, position on track, the gap to the nearest car ahead and behind, incidents, and so on. Over the season that added up to:
| GR86 | F4 | Total | |
|---|---|---|---|
| Sessions | 118 | 59 | 177 |
| Races | 35 | 18 | 53 |
| Hours in the car | 21.5 | 8.3 | 29.8 |
| Distance | 2,705 km | 1,191 km | 3,896 km |
| Laps | 690 | 275 | 965 |
| Heartbeats | 111,389 | 43,867 | 155,256 |
In terms of results, the season went reasonably well. I finished the PCC championship in 87th overall, and F4 in 84th. I was aiming for top 50, but top 100 is still not too bad. Although to be honest, a lot of that is just the consistency of showing up every week.
The physiological metrics
Two metrics are central to everything in this article. Heart rate, which should be fairly self-explanatory, and HRV, heart rate variability. HRV is the beat-to-beat variation in the time between heartbeats, which for this article we measure as RMSSD in milliseconds and smooth out over ten consecutive heartbeats. At these short timescales a lot of that variation comes from breathing – the heart naturally speeds up slightly on the inhale and slows on the exhale. But beyond breathing, HRV drops when the sympathetic, fight-or-flight side of the nervous system takes over. HRV can move on mental load and stress alone, more so than heart rate, before anything physical has happened. Very handwavingly, it's a good proxy metric for stress/arousal.
One thing I want to be clear about, because HRV usually comes with wellness connotations: a drop in HRV is not a bad thing here. Racing needs you switched on (at the right moments), and a driver with the HRV of someone meditating is probably not driving very hard. The interesting questions are where/when the body switches on, by how much, and whether it switches off again and recovers in between. That ability to move between the two states is what sets many elite performers apart, and it is exactly what HRV biofeedback trains.
The start
The first thing I looked at was the race start, and the first thing that stands out is that my body starts ramping up well before the green flag.
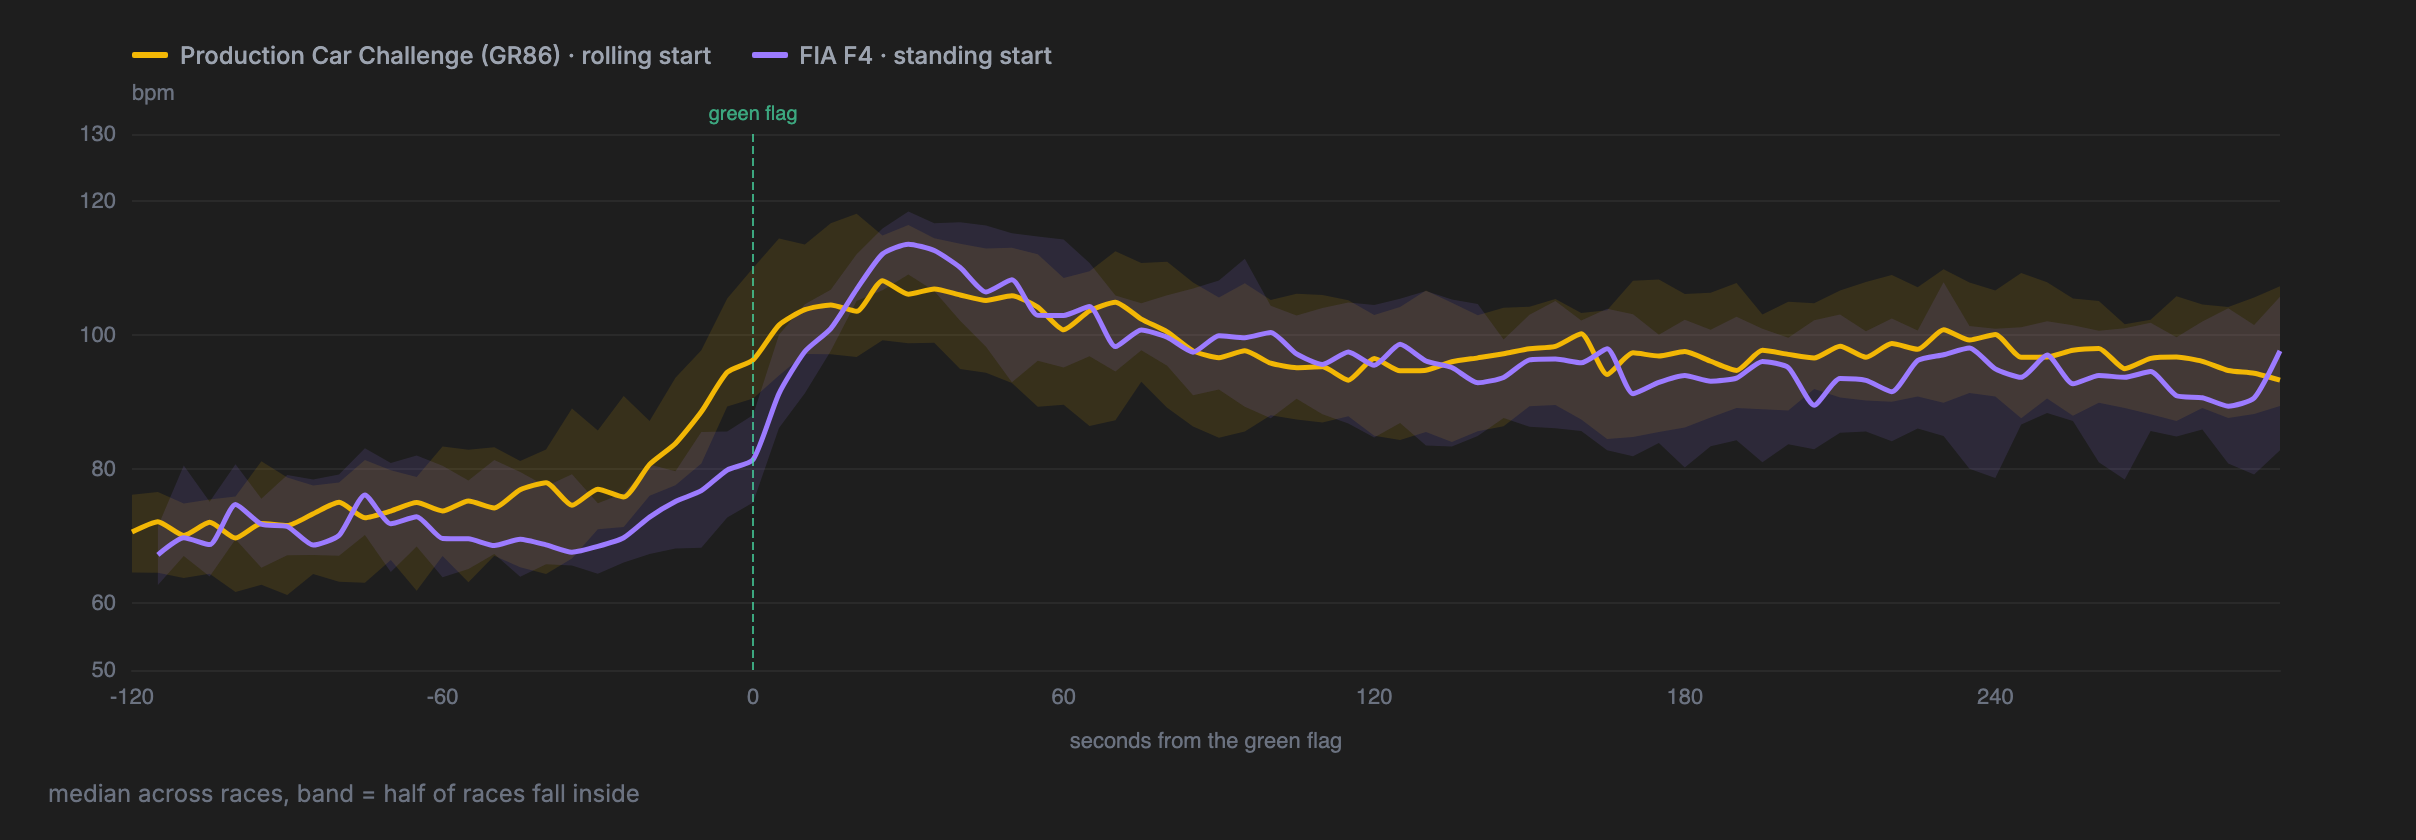
The two series have different start procedures, and it's directly visible in the curves. In the GR86 the start is a rolling one, and the climb begins a full minute before the flag, during the formation lap: from about 70 bpm two minutes out I am already at around 96 when the green comes, and I peak at around 108 some 25 seconds after it. In the F4 the start is standing. And already about 20 or 30 seconds before the start, my heart rate starts climbing in anticipation. Then the moment the lights go out heart rate sharply rises, from 81 at the start to a peak of around 114 within 30 seconds.
HRV essentially tells the same story.
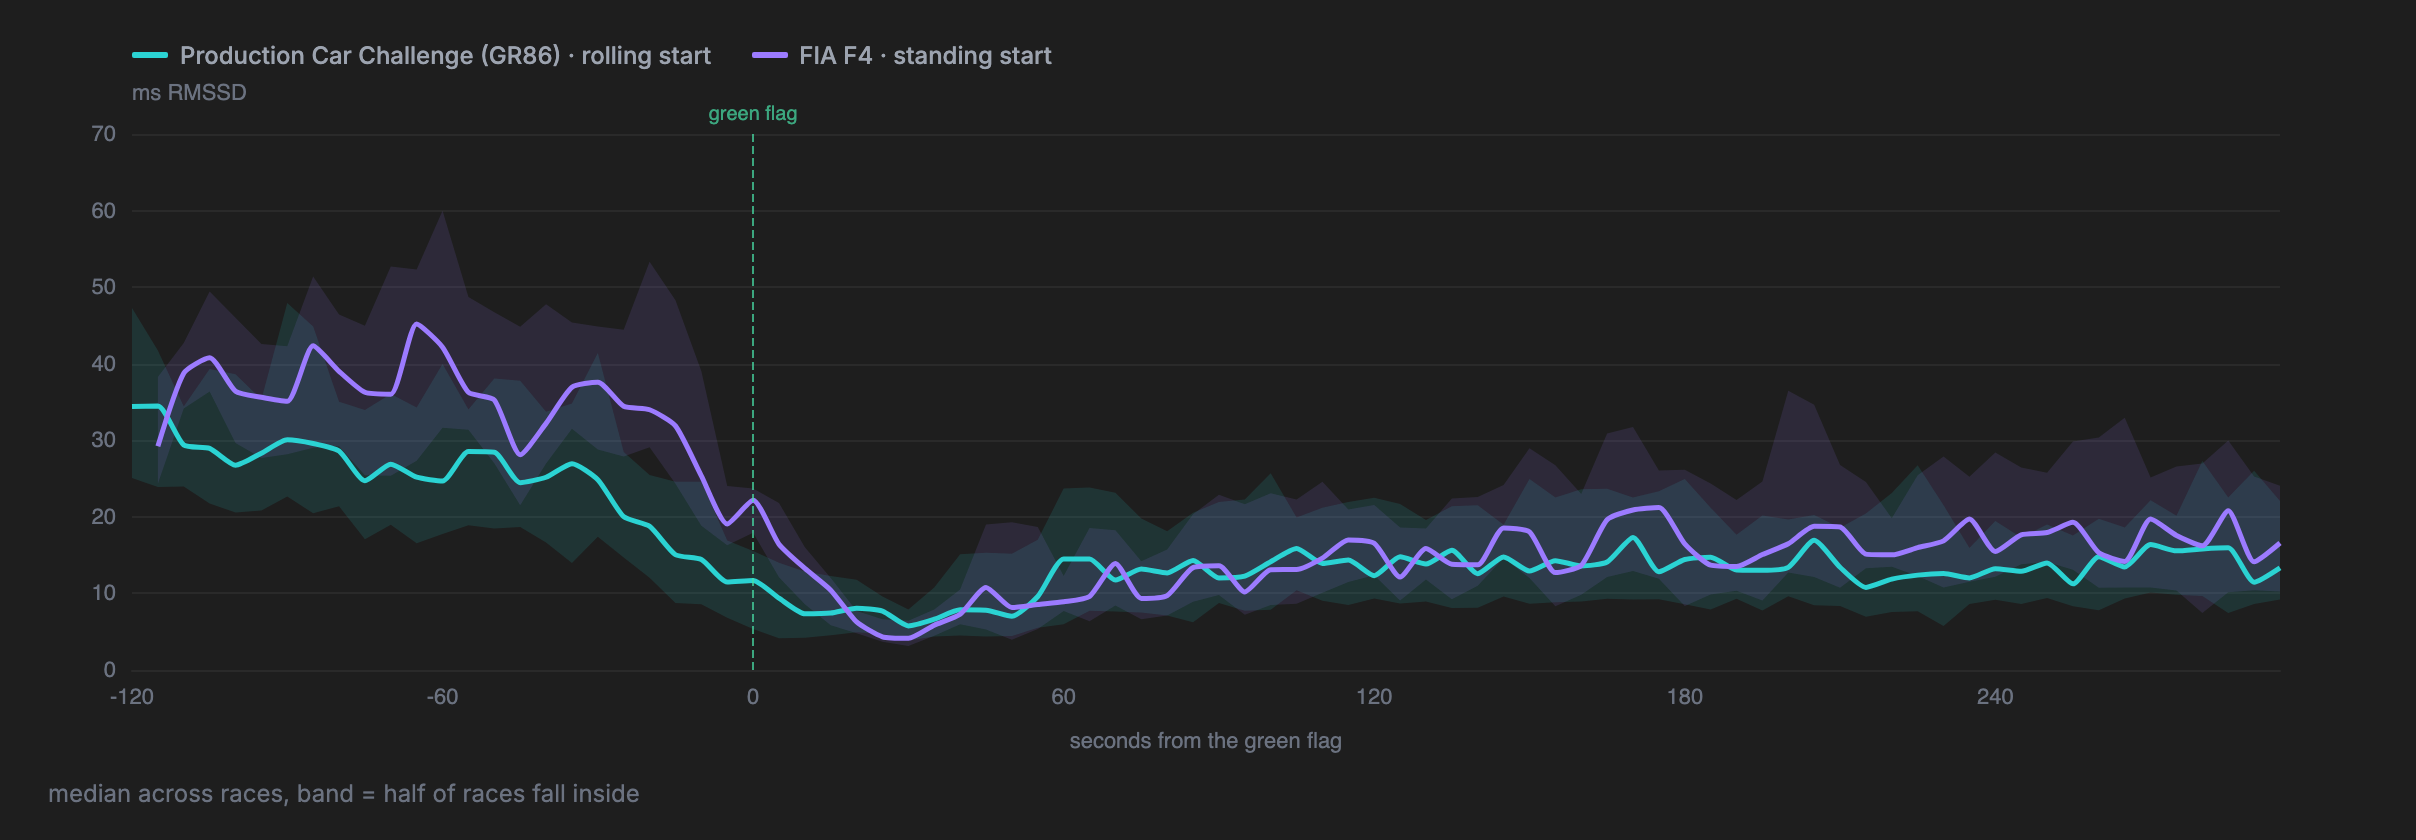
None of this came as a huge surprise, starts feel stressful. But I had not expected to see the anticipation quite so cleanly, or the difference between a rolling and a standing start quite so clearly. There is also a first hint here of something that shows up throughout the season: the data indicates that F4 is (maybe not too surprisingly) a slightly more physically intense experience.
Fights
Fights are by far the clearest signal in the whole season. Before the results, let's define what exactly we mean by fights and related concepts: a fight is another car within half a second, ahead or behind, for at least 20 seconds. Clean air is no car within 1.5 seconds on either side. The zone in between, 0.5 to 1.5 seconds, I will call near. And the first two minutes after the start are excluded from all fight data below, to not conflate the two effects.
Of the 14.4 hours of green-flag racing, only 30% was clean air. I spent 5.4 hours – 37% of all my racing – within half a second of another car, across 264 distinct fights, or a little over five per race. The longest sustained fight was just under ten minutes, at Lime Rock.
An important note on how all of the comparisons in this section are made, because it's key to the analysis: My baseline heart rate on a given day depends on sleep, exercise, stress, coffee and a dozen other things the strap cannot see, and it moves by tens of beats from one week to the next (more on that later). So every number here is computed within a race: my physiology with a car nearby, compared with my own clean-air running in that same race, on that same day. I then take the median across races, so that no single race dominates, and the whiskers on the charts are 95% confidence intervals of that median.
The closer the car, the bigger the response
The result that surprised me most in the entire season is this one. I took every sample of green-flag racing, binned it by the distance to the nearest car in 10-metre steps, worked out how far my heart rate and HRV in each bin sat from that race's clean-air level, and took the median across races.
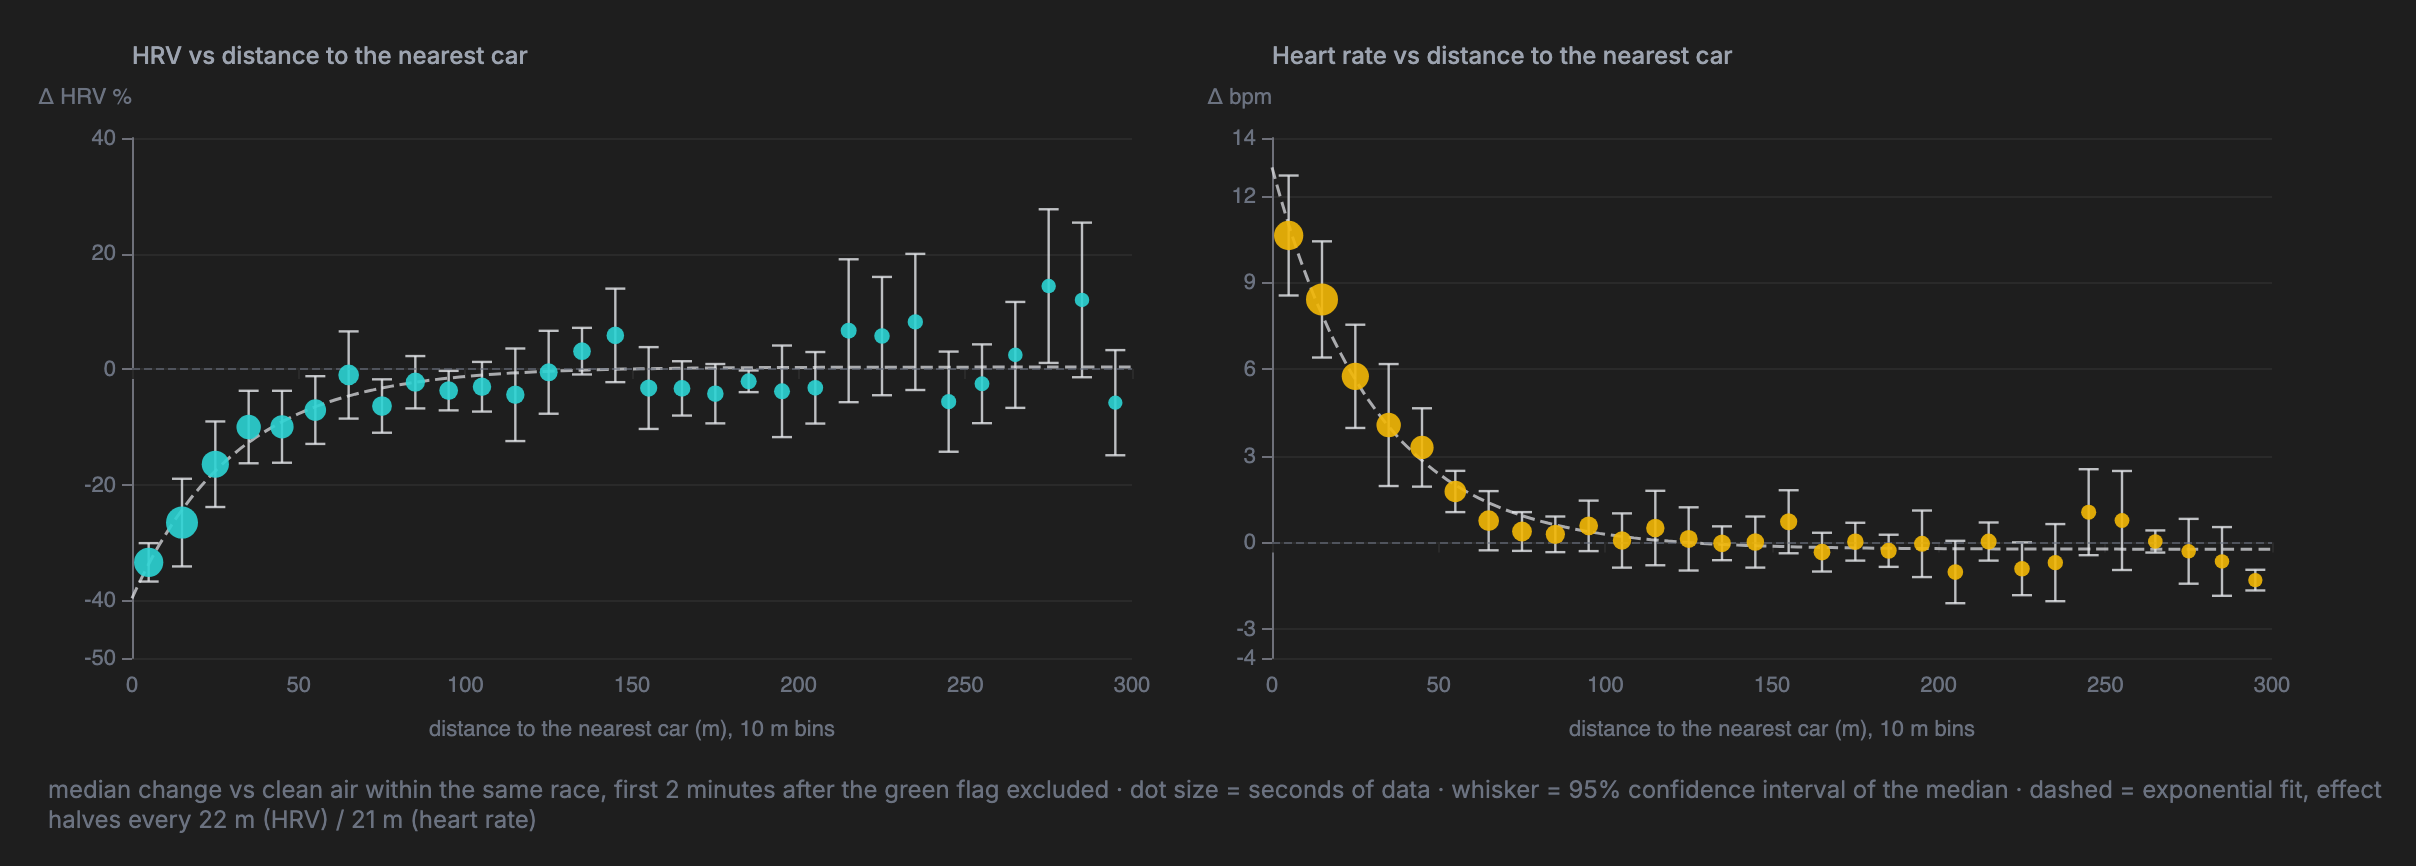
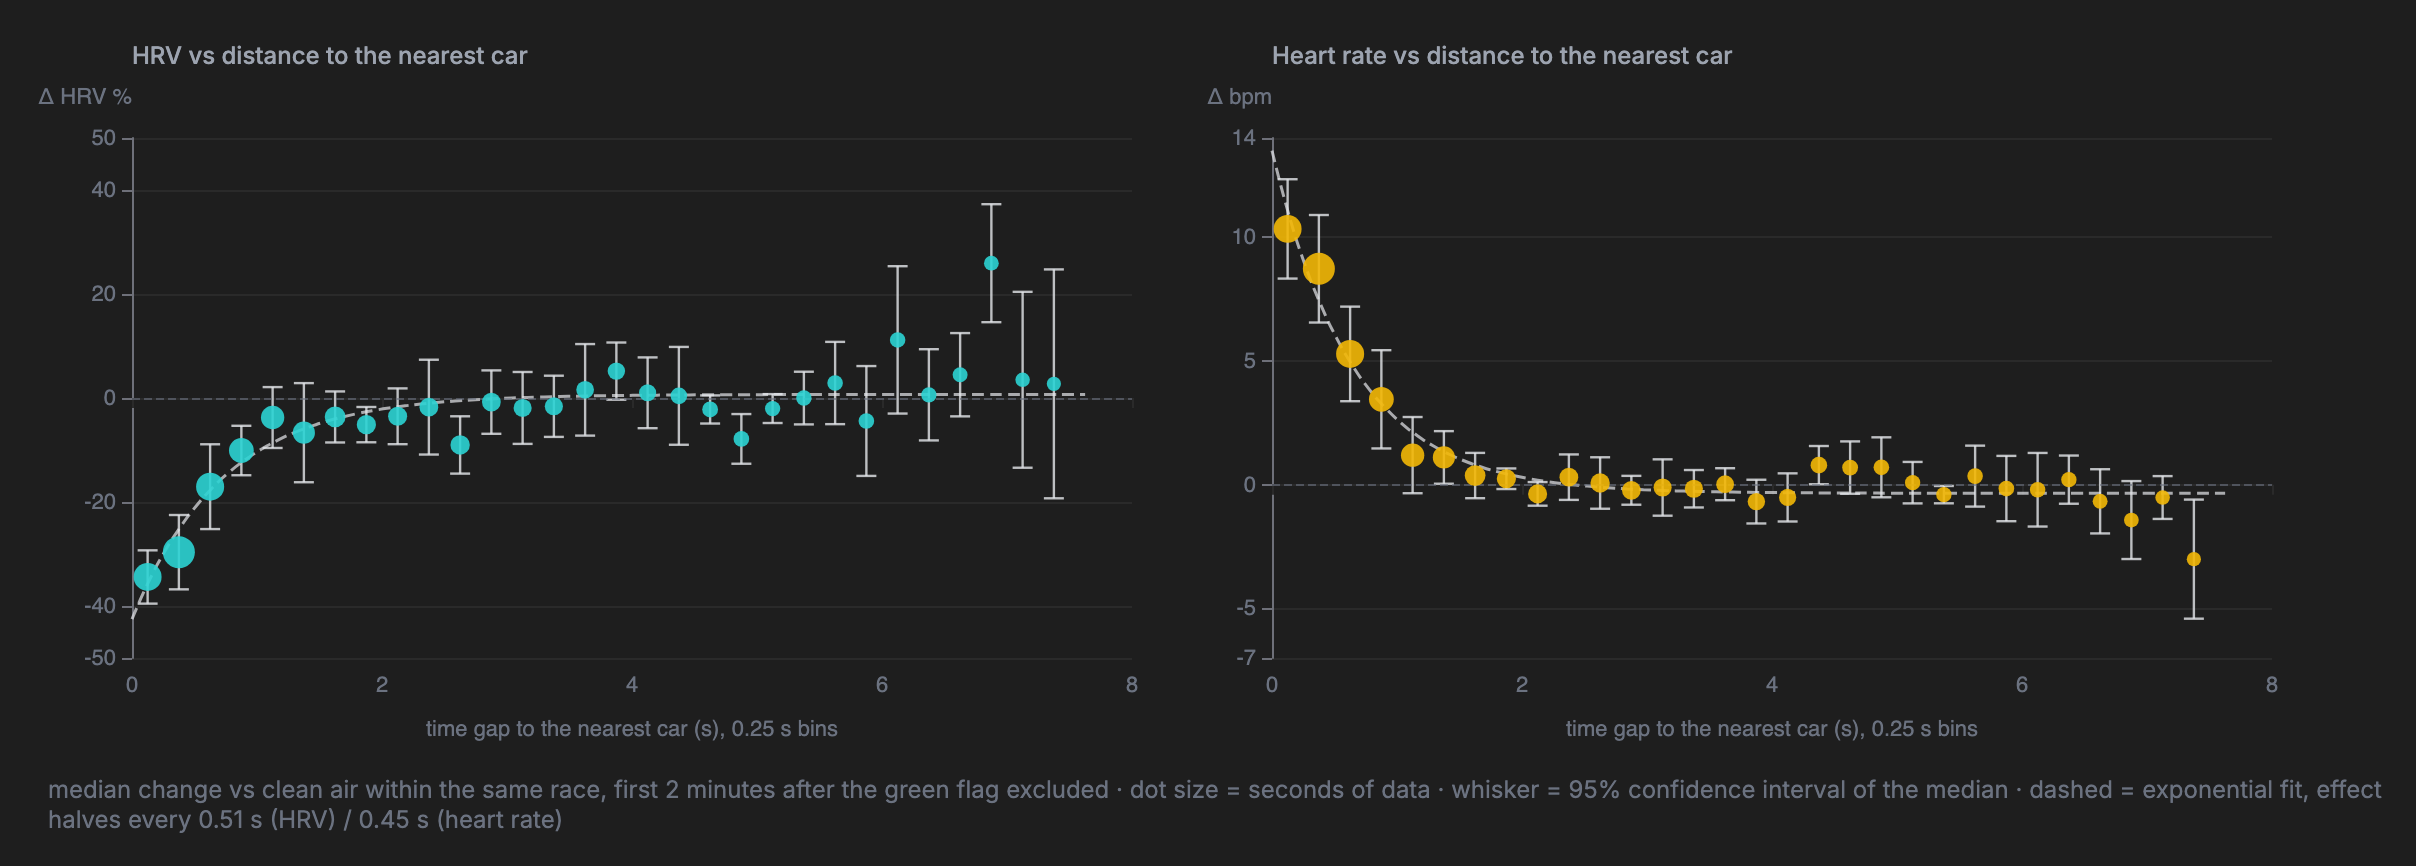
I did expect my physiology to respond to running closer to other cars, but I did not expect the relationship to be this clean. Heart rate rises exponentially as the gap closes: about +13 bpm when I am right on another car, half of that at around 21 metres, and indistinguishable from clean air beyond about 100 metres. A simple exponential explains 97% of the variation across the bins. HRV does the same thing in the other direction: about 40% below clean air at "contact", halving on almost exactly the same length scale, and gone by 100 metres.
Fitting the two series separately gives the same curve twice, with the F4 a little steeper and a little higher.
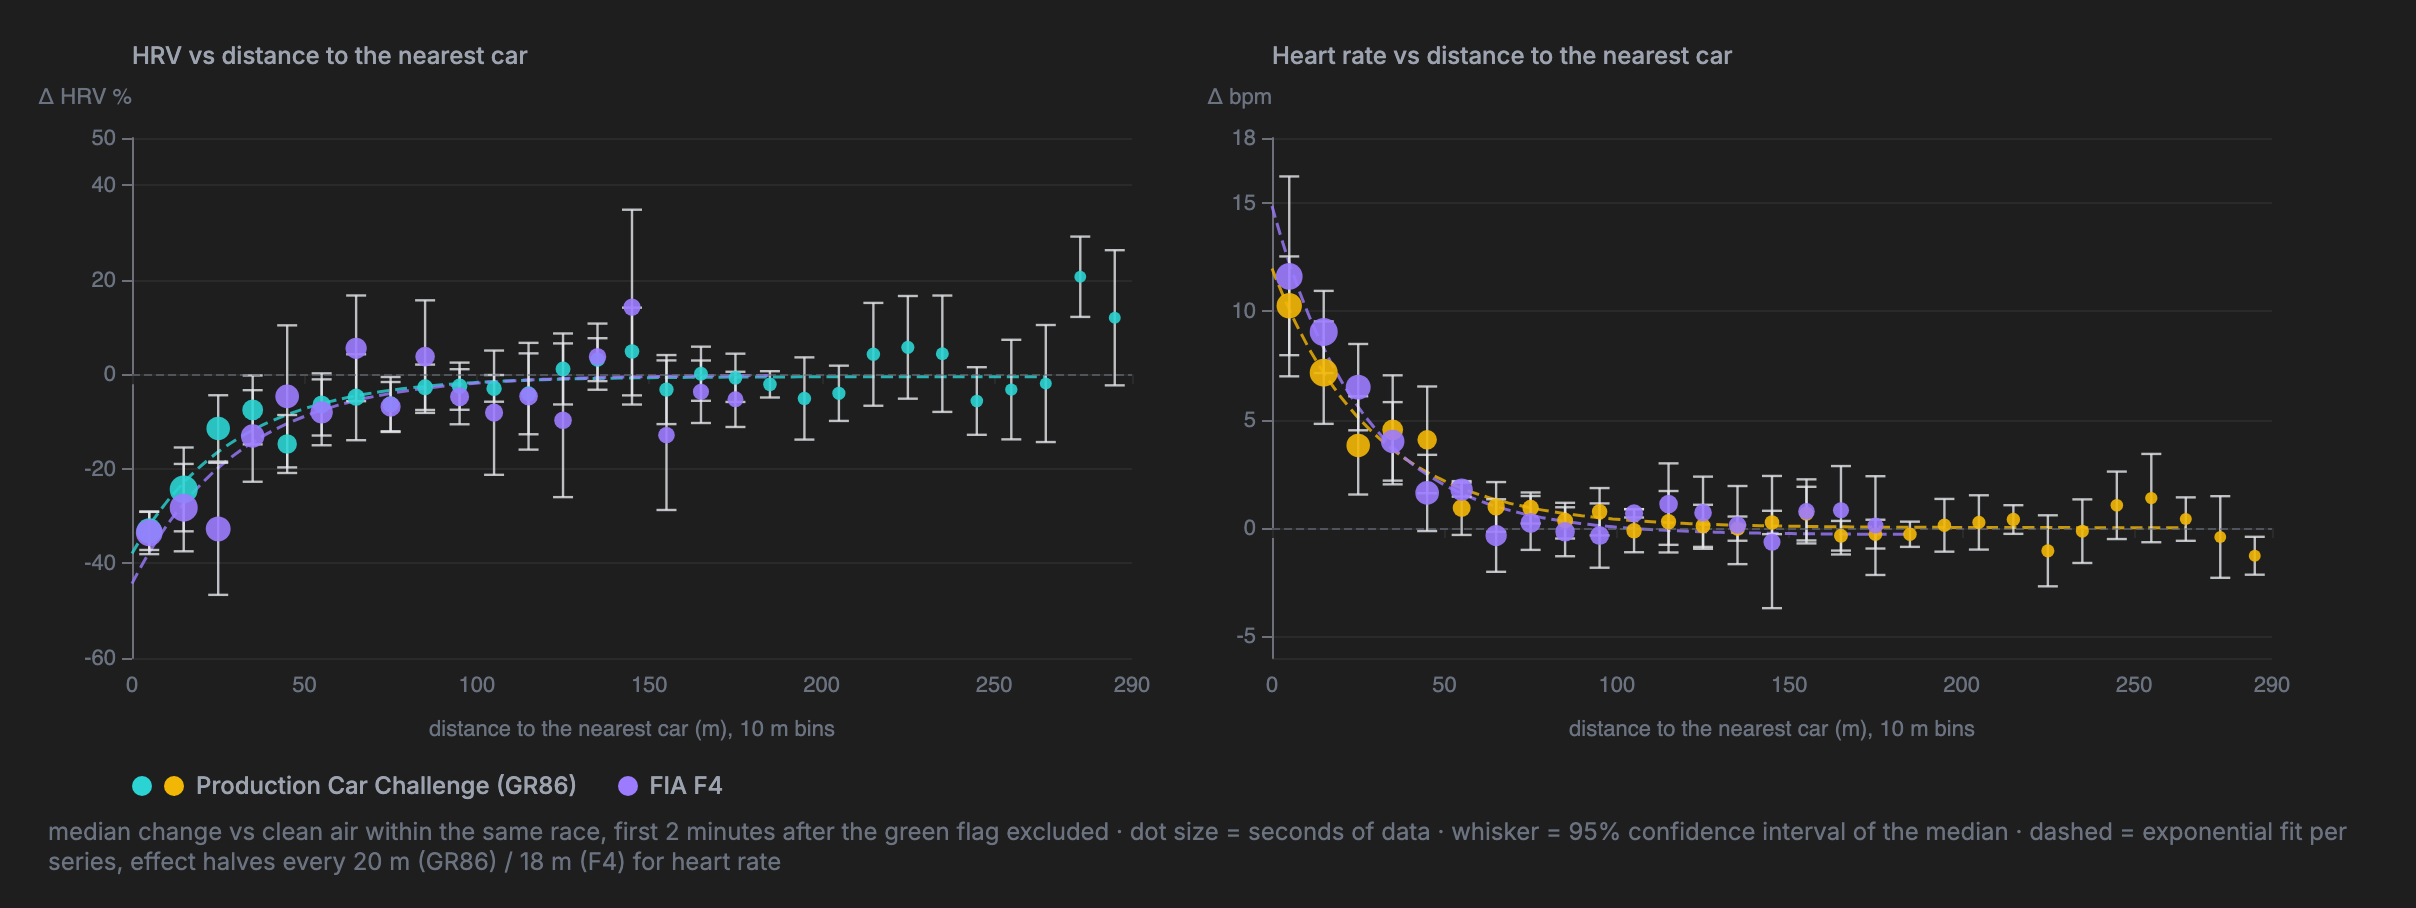
In the GR86 the effect at zero distance is about +12 bpm, halving every 20 metres. In the F4 it is about +15 bpm, halving every 18 metres. The same hint as at the start – F4 being slightly more intense, especially in close racing. But the overall shape holds remarkably well between the two cars.
Using the time gap instead of the distance gives, unsurprisingly, the same picture.
Ahead, behind, boxed in
Distance is not the whole story. It also matters where the car is. ApexFlow classifies every moment of a race as clean air, near, a car within half a second ahead, a car within half a second behind, or boxed in with cars on both sides.
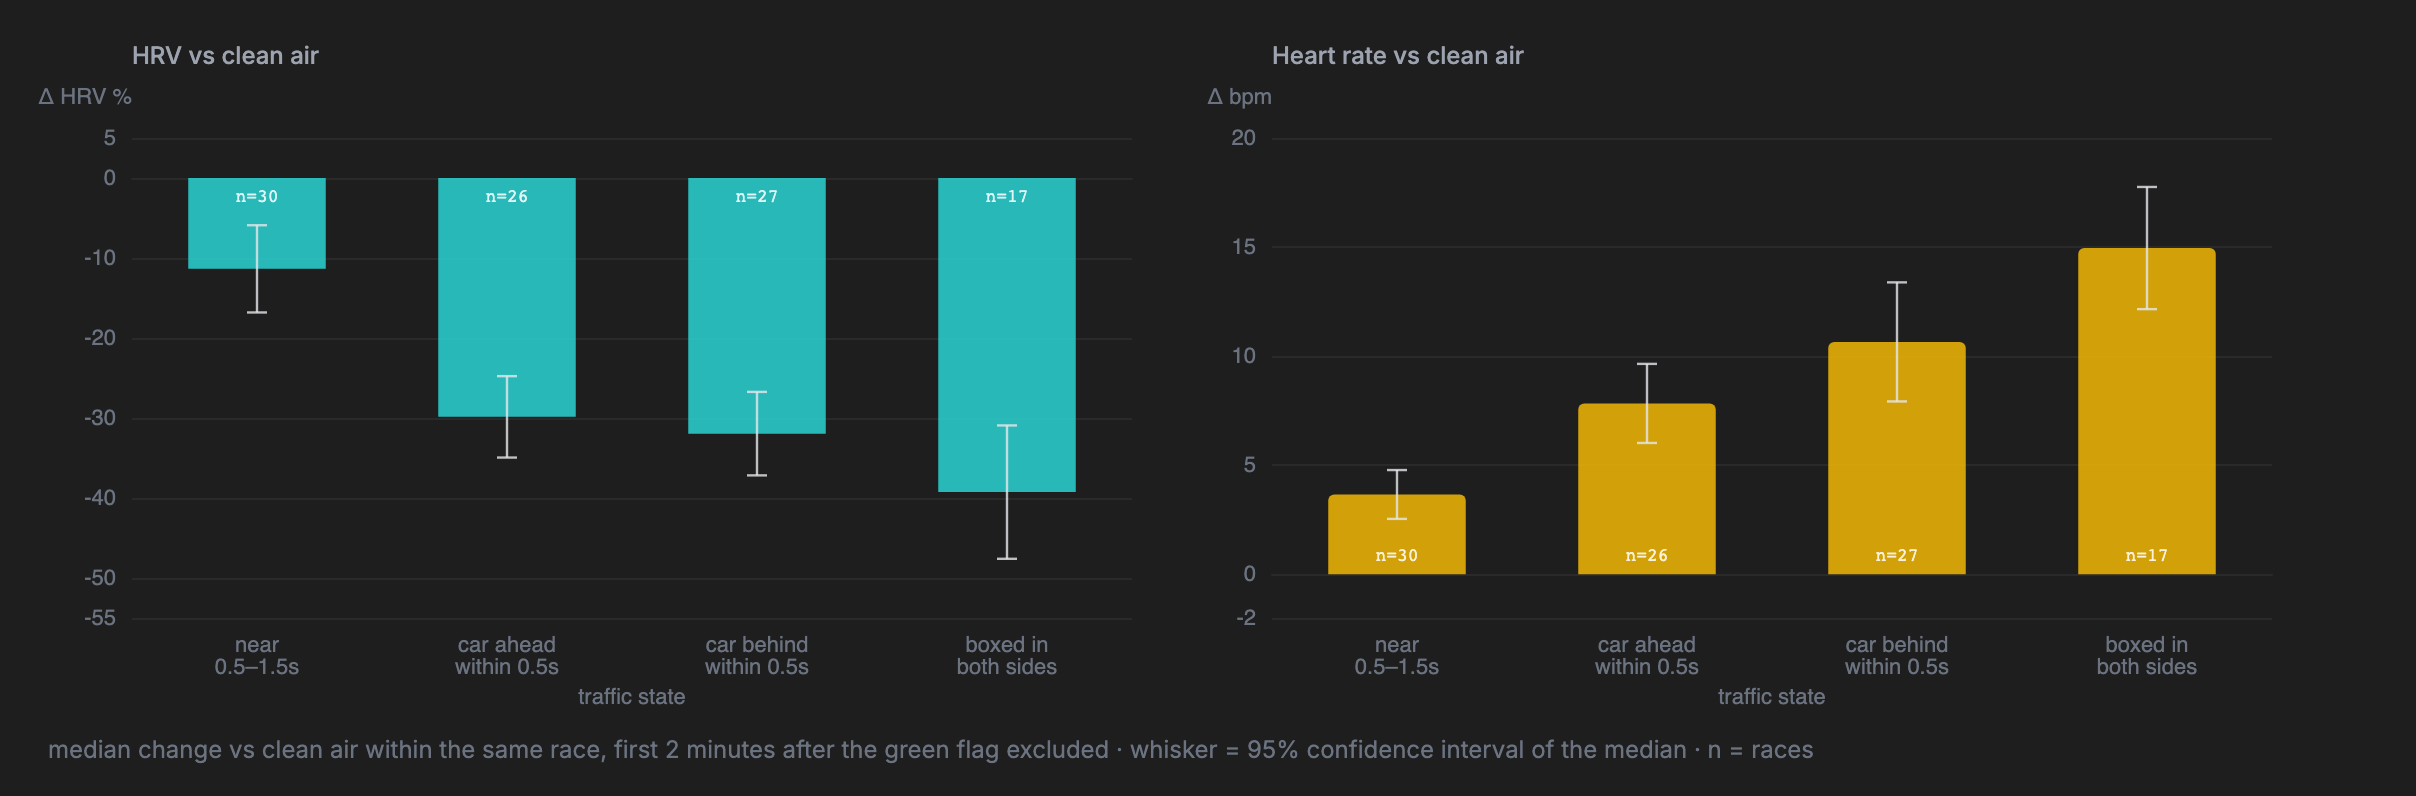
From the data, defending seems a bit more intense than attacking. That matches how it feels: it's usually easier to hunt than to be hunted. Boxed in being the worst of all is not surprising either, but it is nice to see it come out so cleanly in the data.
How long the fight lasts
ApexFlow also measures each fight against the clean air just before it began. Here are all 206 fights from outside the start window, grouped by how long they lasted.
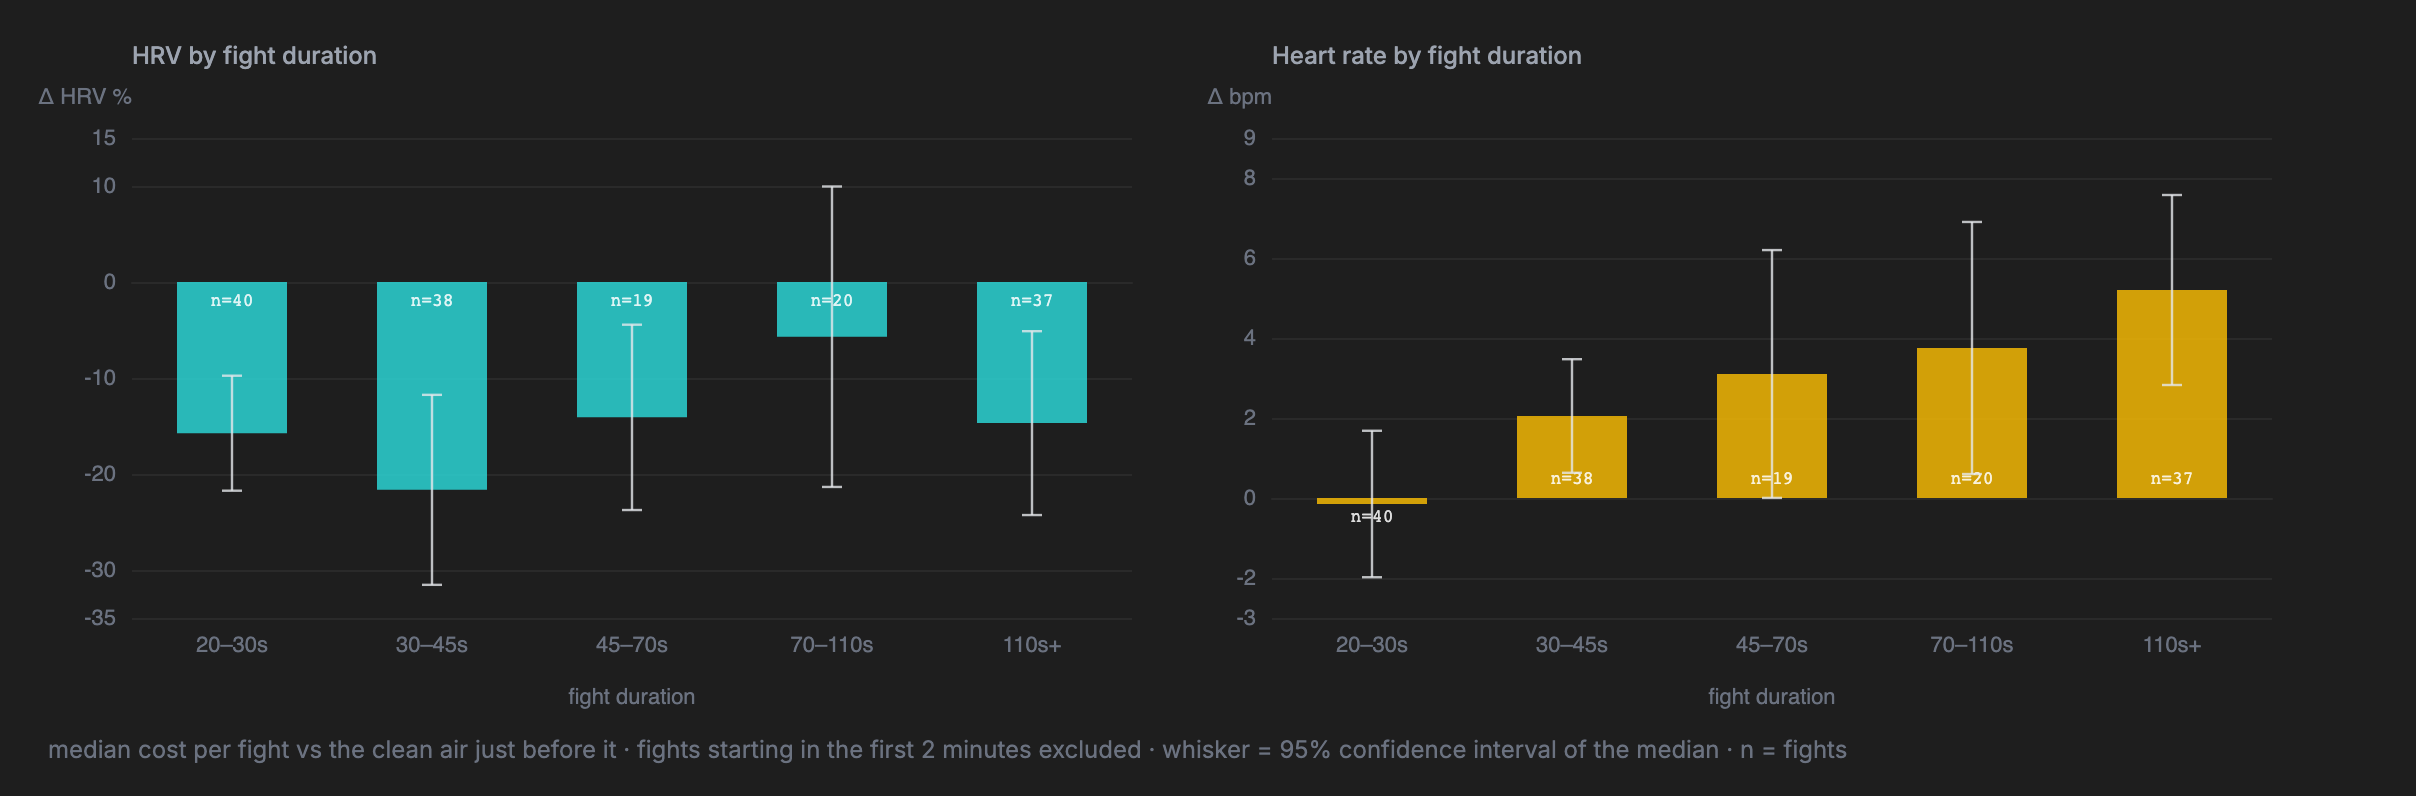
Heart rate behaves very cleanly here: a 20 to 30 second battle barely moves it, and from there it climbs steadily with duration, to a median of about +5 bpm through the fights that last around two minutes or more. HRV does something different. It is down in every bin, by somewhere between 6 and 22%, but it does not scale with duration at all. Interestingly, the two signals seem to be measuring different things: HRV reacts within seconds and is already fully committed in the shortest fights, while heart rate accumulates the longer the fight goes on.
Braking
Away from other cars, the biggest single stressor is heavy braking zones, so that is where I looked for the response to the driving itself. ApexFlow's braking response takes every heavy braking event – at least 30% brake pressure after at least two seconds off it, which picks out the bigger braking zones rather than every dab of the brake – and averages heart rate around the moment of brake onset, relative to the five seconds before. For the analysis I used only braking events with no car within 1.5 seconds, so that what is left is the corner and nothing else. That gave 471 events in the GR86 and 282 in the F4.
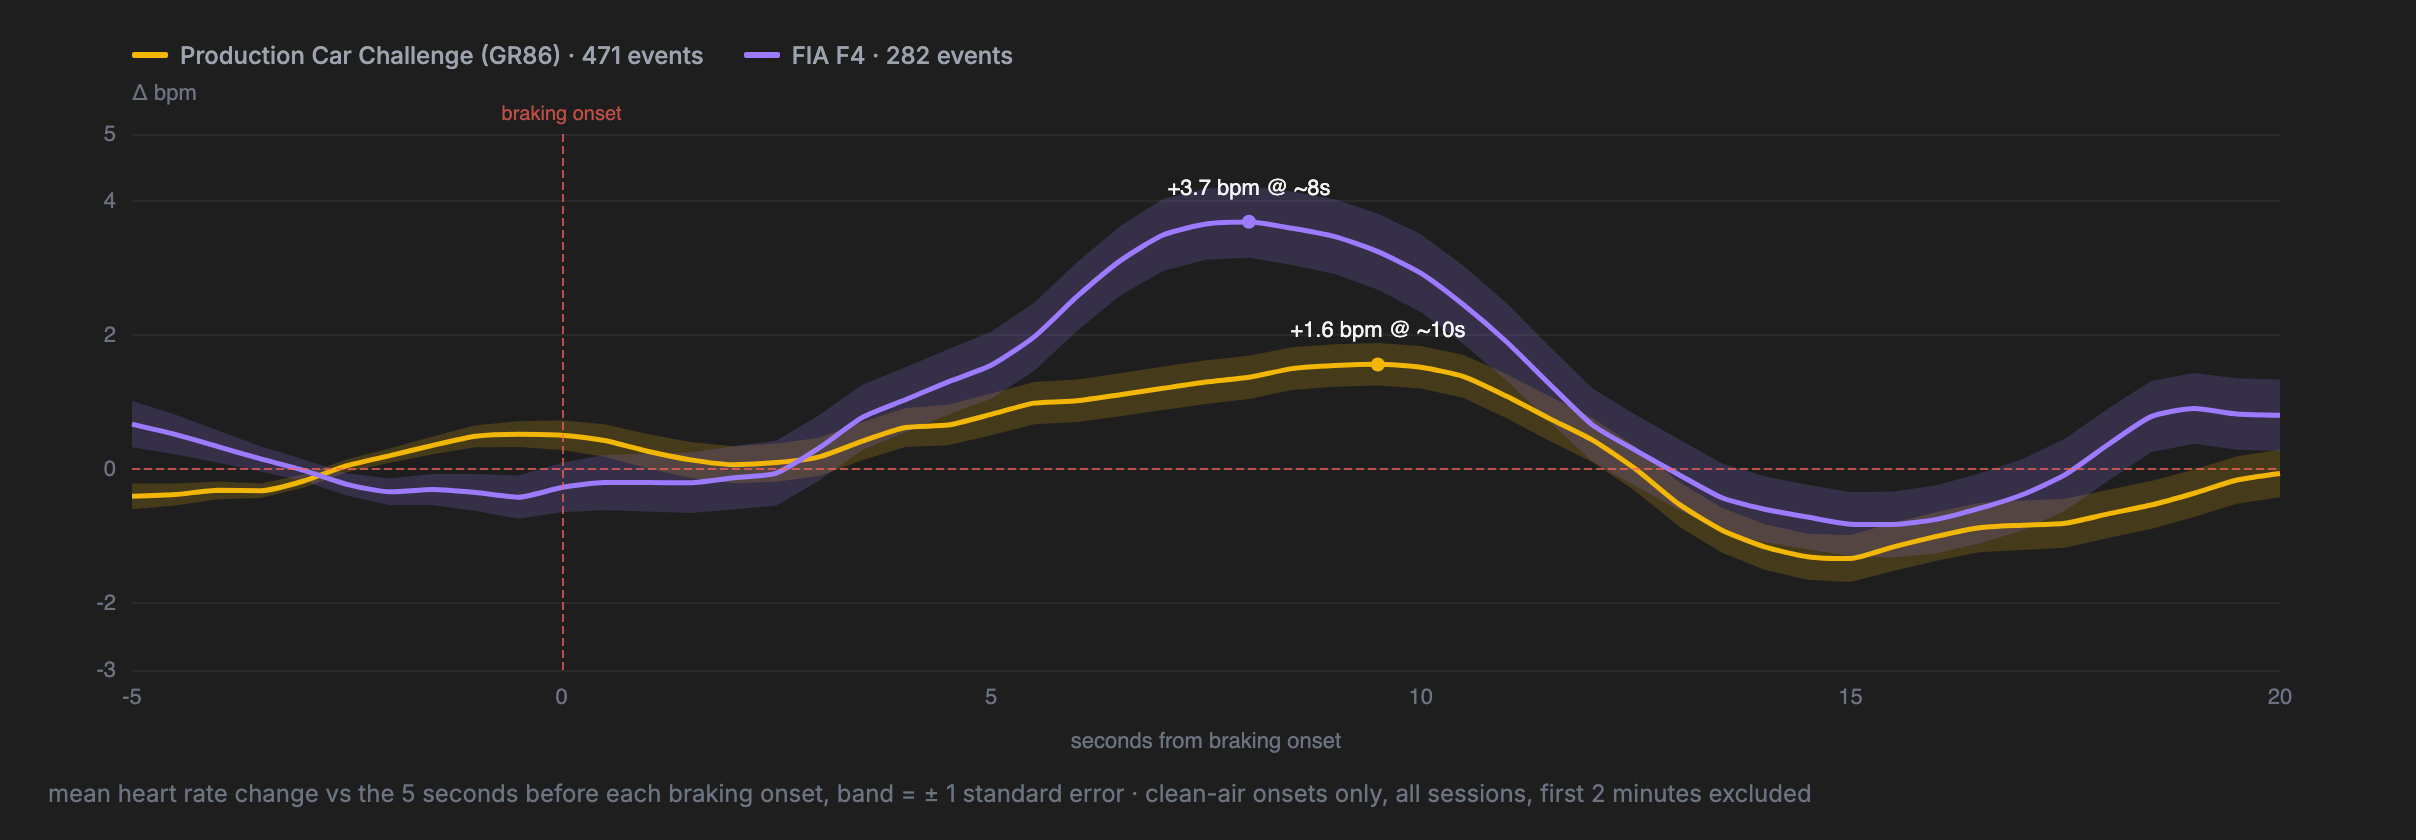
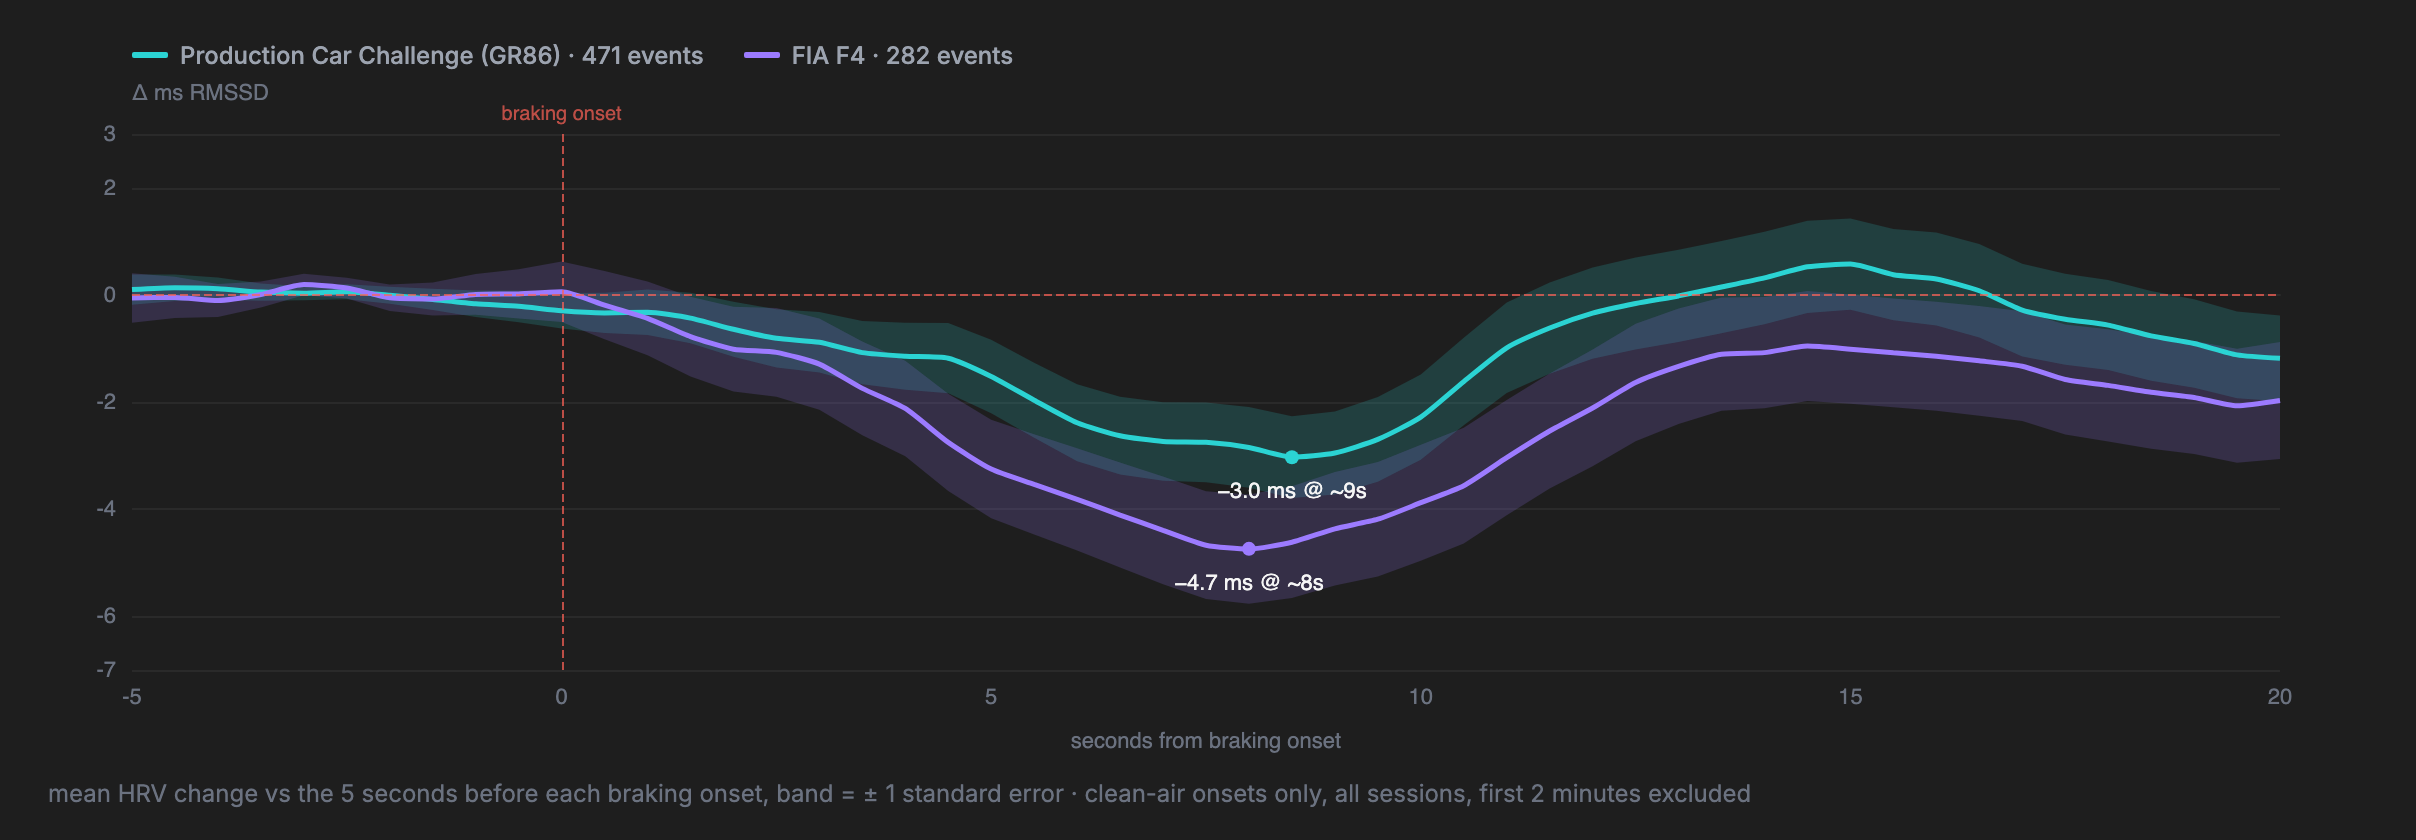
Two things show up nicely. The first is the delay. Heart rate does not move for the first two or three seconds after the brake goes on, then rises to a peak eight to ten seconds later, and then dips below where it started at around fifteen seconds, which I would guess is the breath out on the following straight. HRV draws the same curve upside down. The delay is real, though a little exaggerated here: the curves are locked to the moment the brake goes on, but the corner keeps making demands after that point, through trail braking, apex and exit, so the true lag between the demanding moment and the response is shorter than eight seconds. The second is the car difference of the F4 again: a peak of about +3.7 bpm against +1.6 in the GR86, and an HRV dip of about 4.7 ms against 3.0. Shorter, harder, more intense braking zones – the car's nature showing up in my body's response.
What I find most telling, though, is the scale. A heavy braking zone in clean air costs two to four beats for about ten seconds. A car within half a second costs eight to fifteen beats for as long as it stays there. The driving does register, but it's small compared to the effect of other cars.
It is worth remembering at this point that this is sim racing. The gap between sim and real is getting smaller and smaller, but from my own experience on a real track, the physical side is where the two are still furthest apart. In the sim there are no g-forces to brace against, no heat (which is what I personally struggle with the most), and no braking zone at 200+ km/h that your body actually believes in. What is left is (mostly) the mental side of driving, and I find it quite remarkable that even that leaves a measurable trace – a few beats per corner, every corner, for a whole season. I would expect the real-world version of this curve to be far more extreme, and I hope to test that myself in the not too distant future.
The track maps
Everything so far was about whole-season-averages. What I was actually planning to look at before going into this analysis was mainly track and car differences. But the start and traffic results proved far more interesting. Still, questions like "what is the most stressful track" are interesting, so let's have a look. But before doing that, there needs to be another big caveat. My baseline physiology on a given day is set by things the telemetry or physio data cannot see – how I slept, what and when I ate, how stressful my day was, and many other factors. This makes genuine fair comparisons across tracks, weeks or series very hard. What still works is comparing a track with itself, and that is what the maps below do.
Each map shows heart rate relative to that session's own average, by position on track, aggregated across every session at the same track, with one shared colour scale across all twelve maps and the first two minutes of each session excluded. First the GR86 calendar, heart rate and then HRV. Note that on the HRV maps the scale is flipped, so that red means stressed on both.
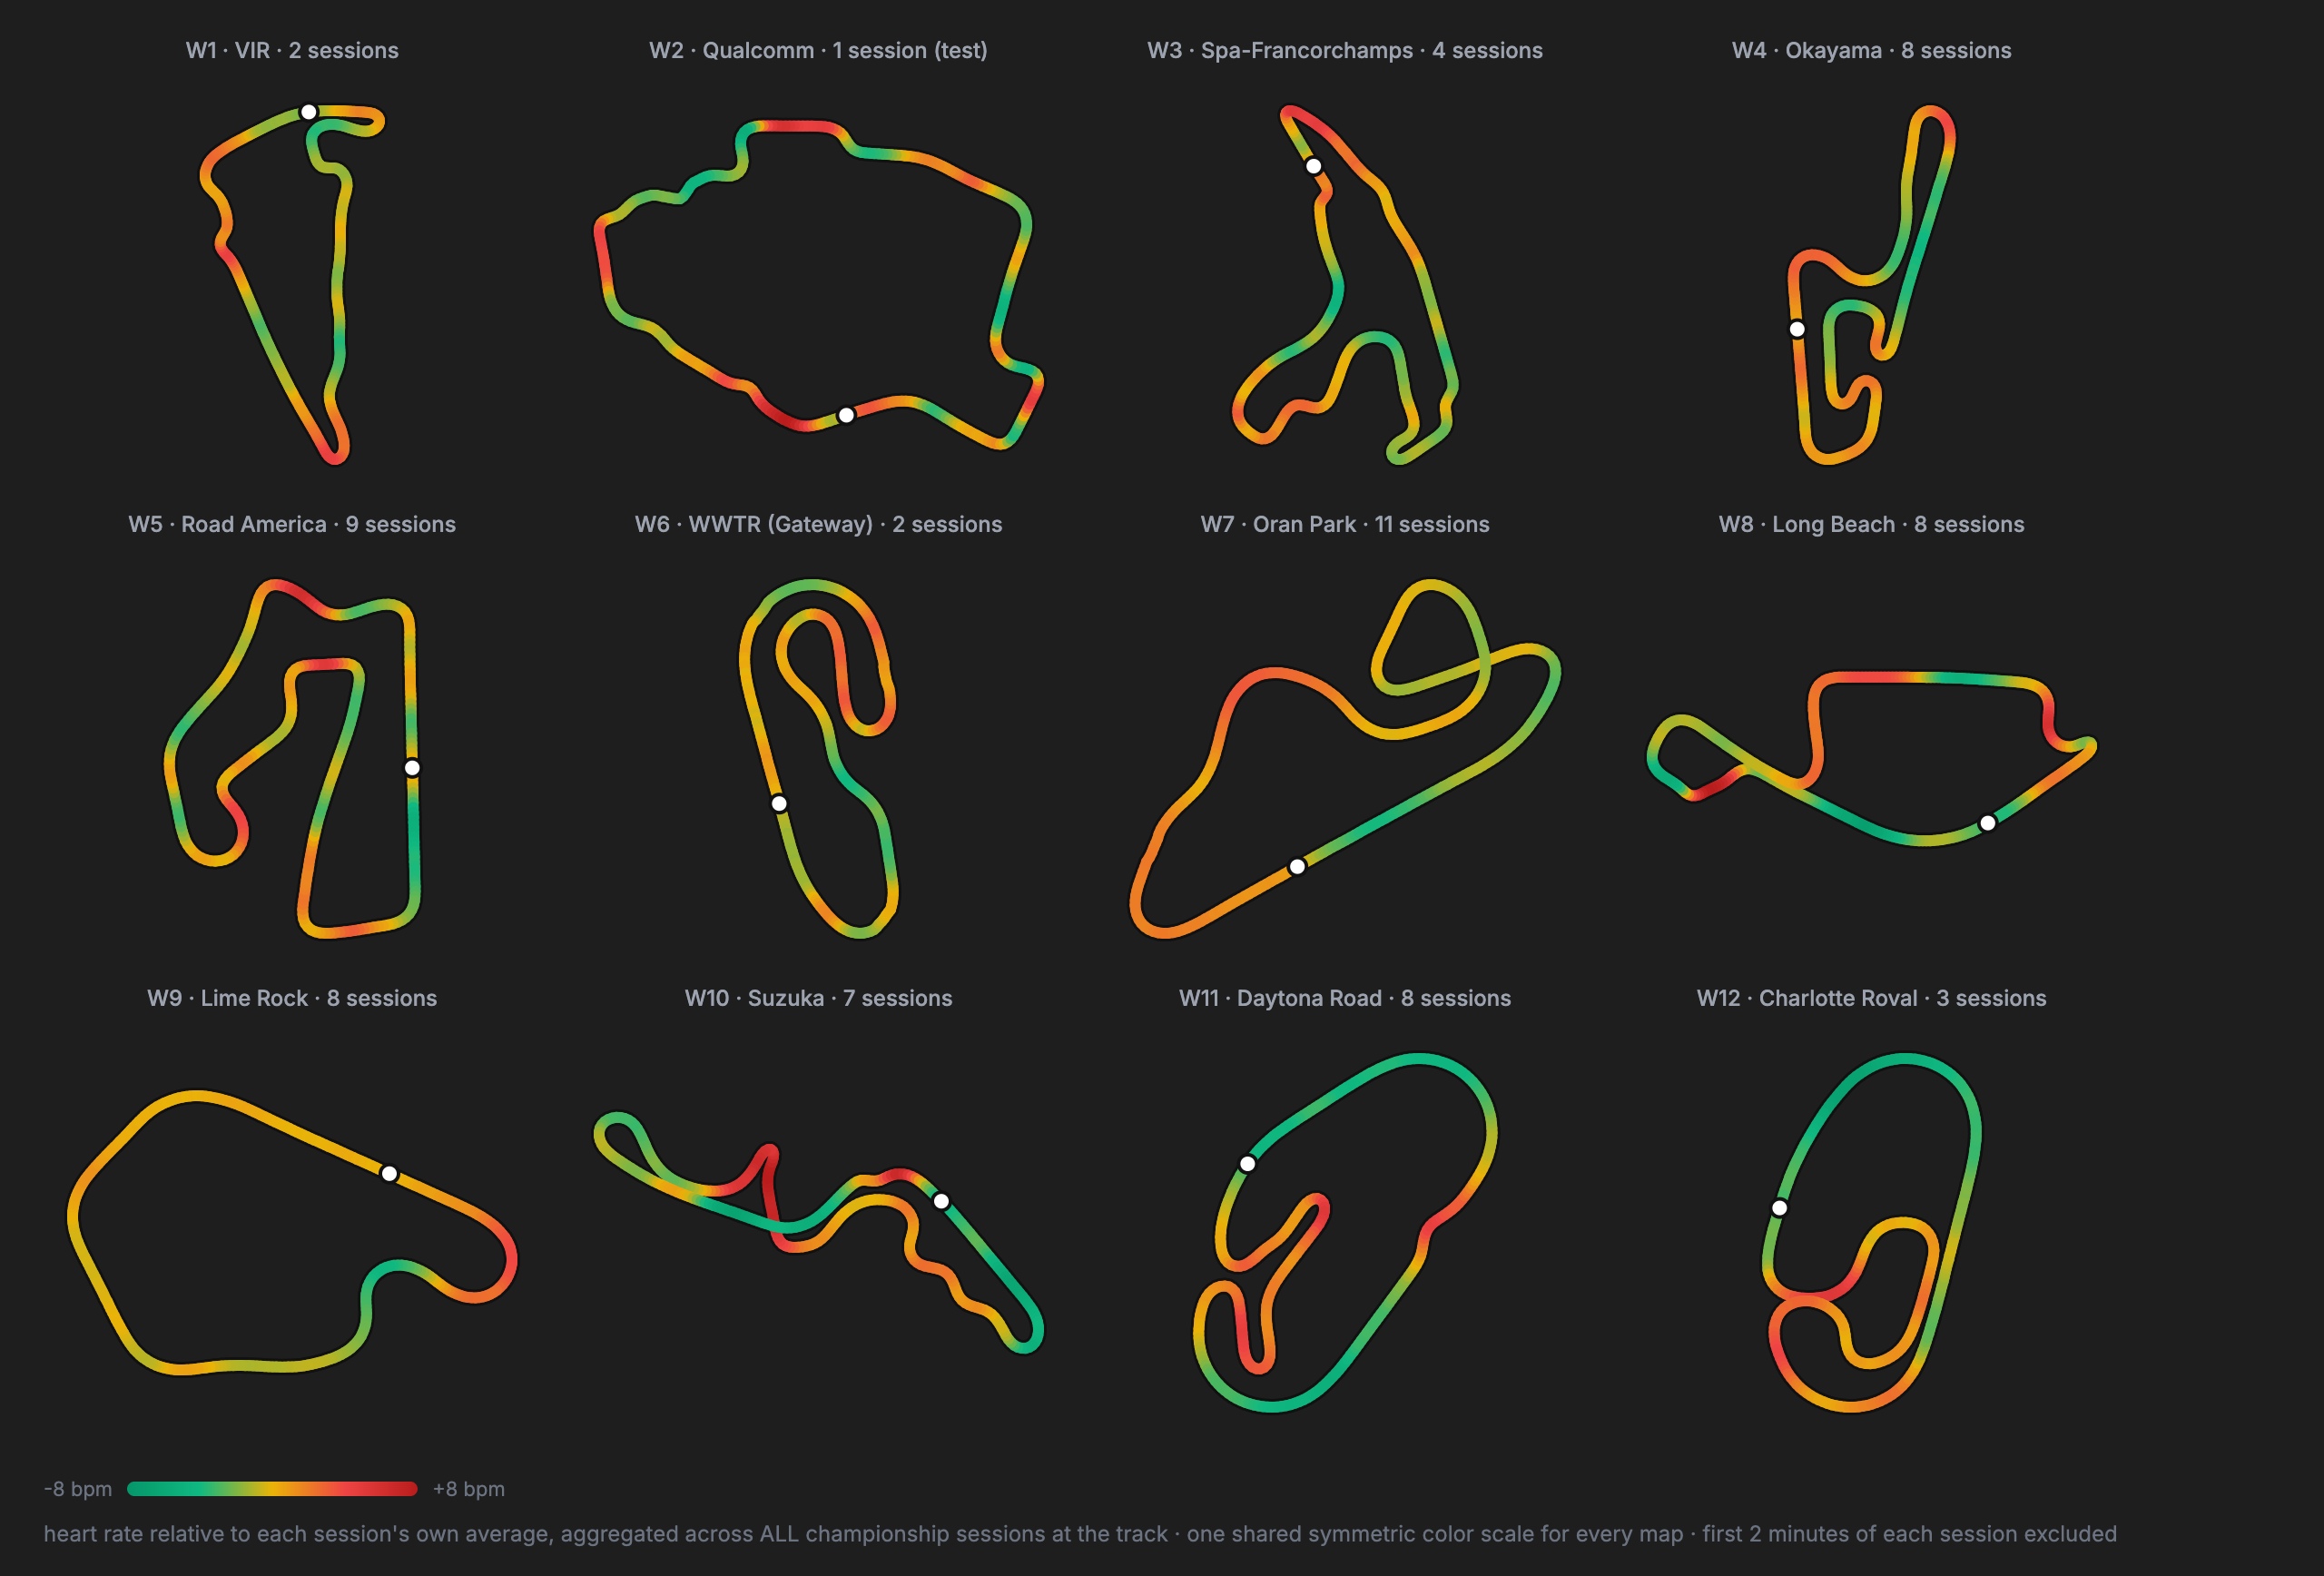
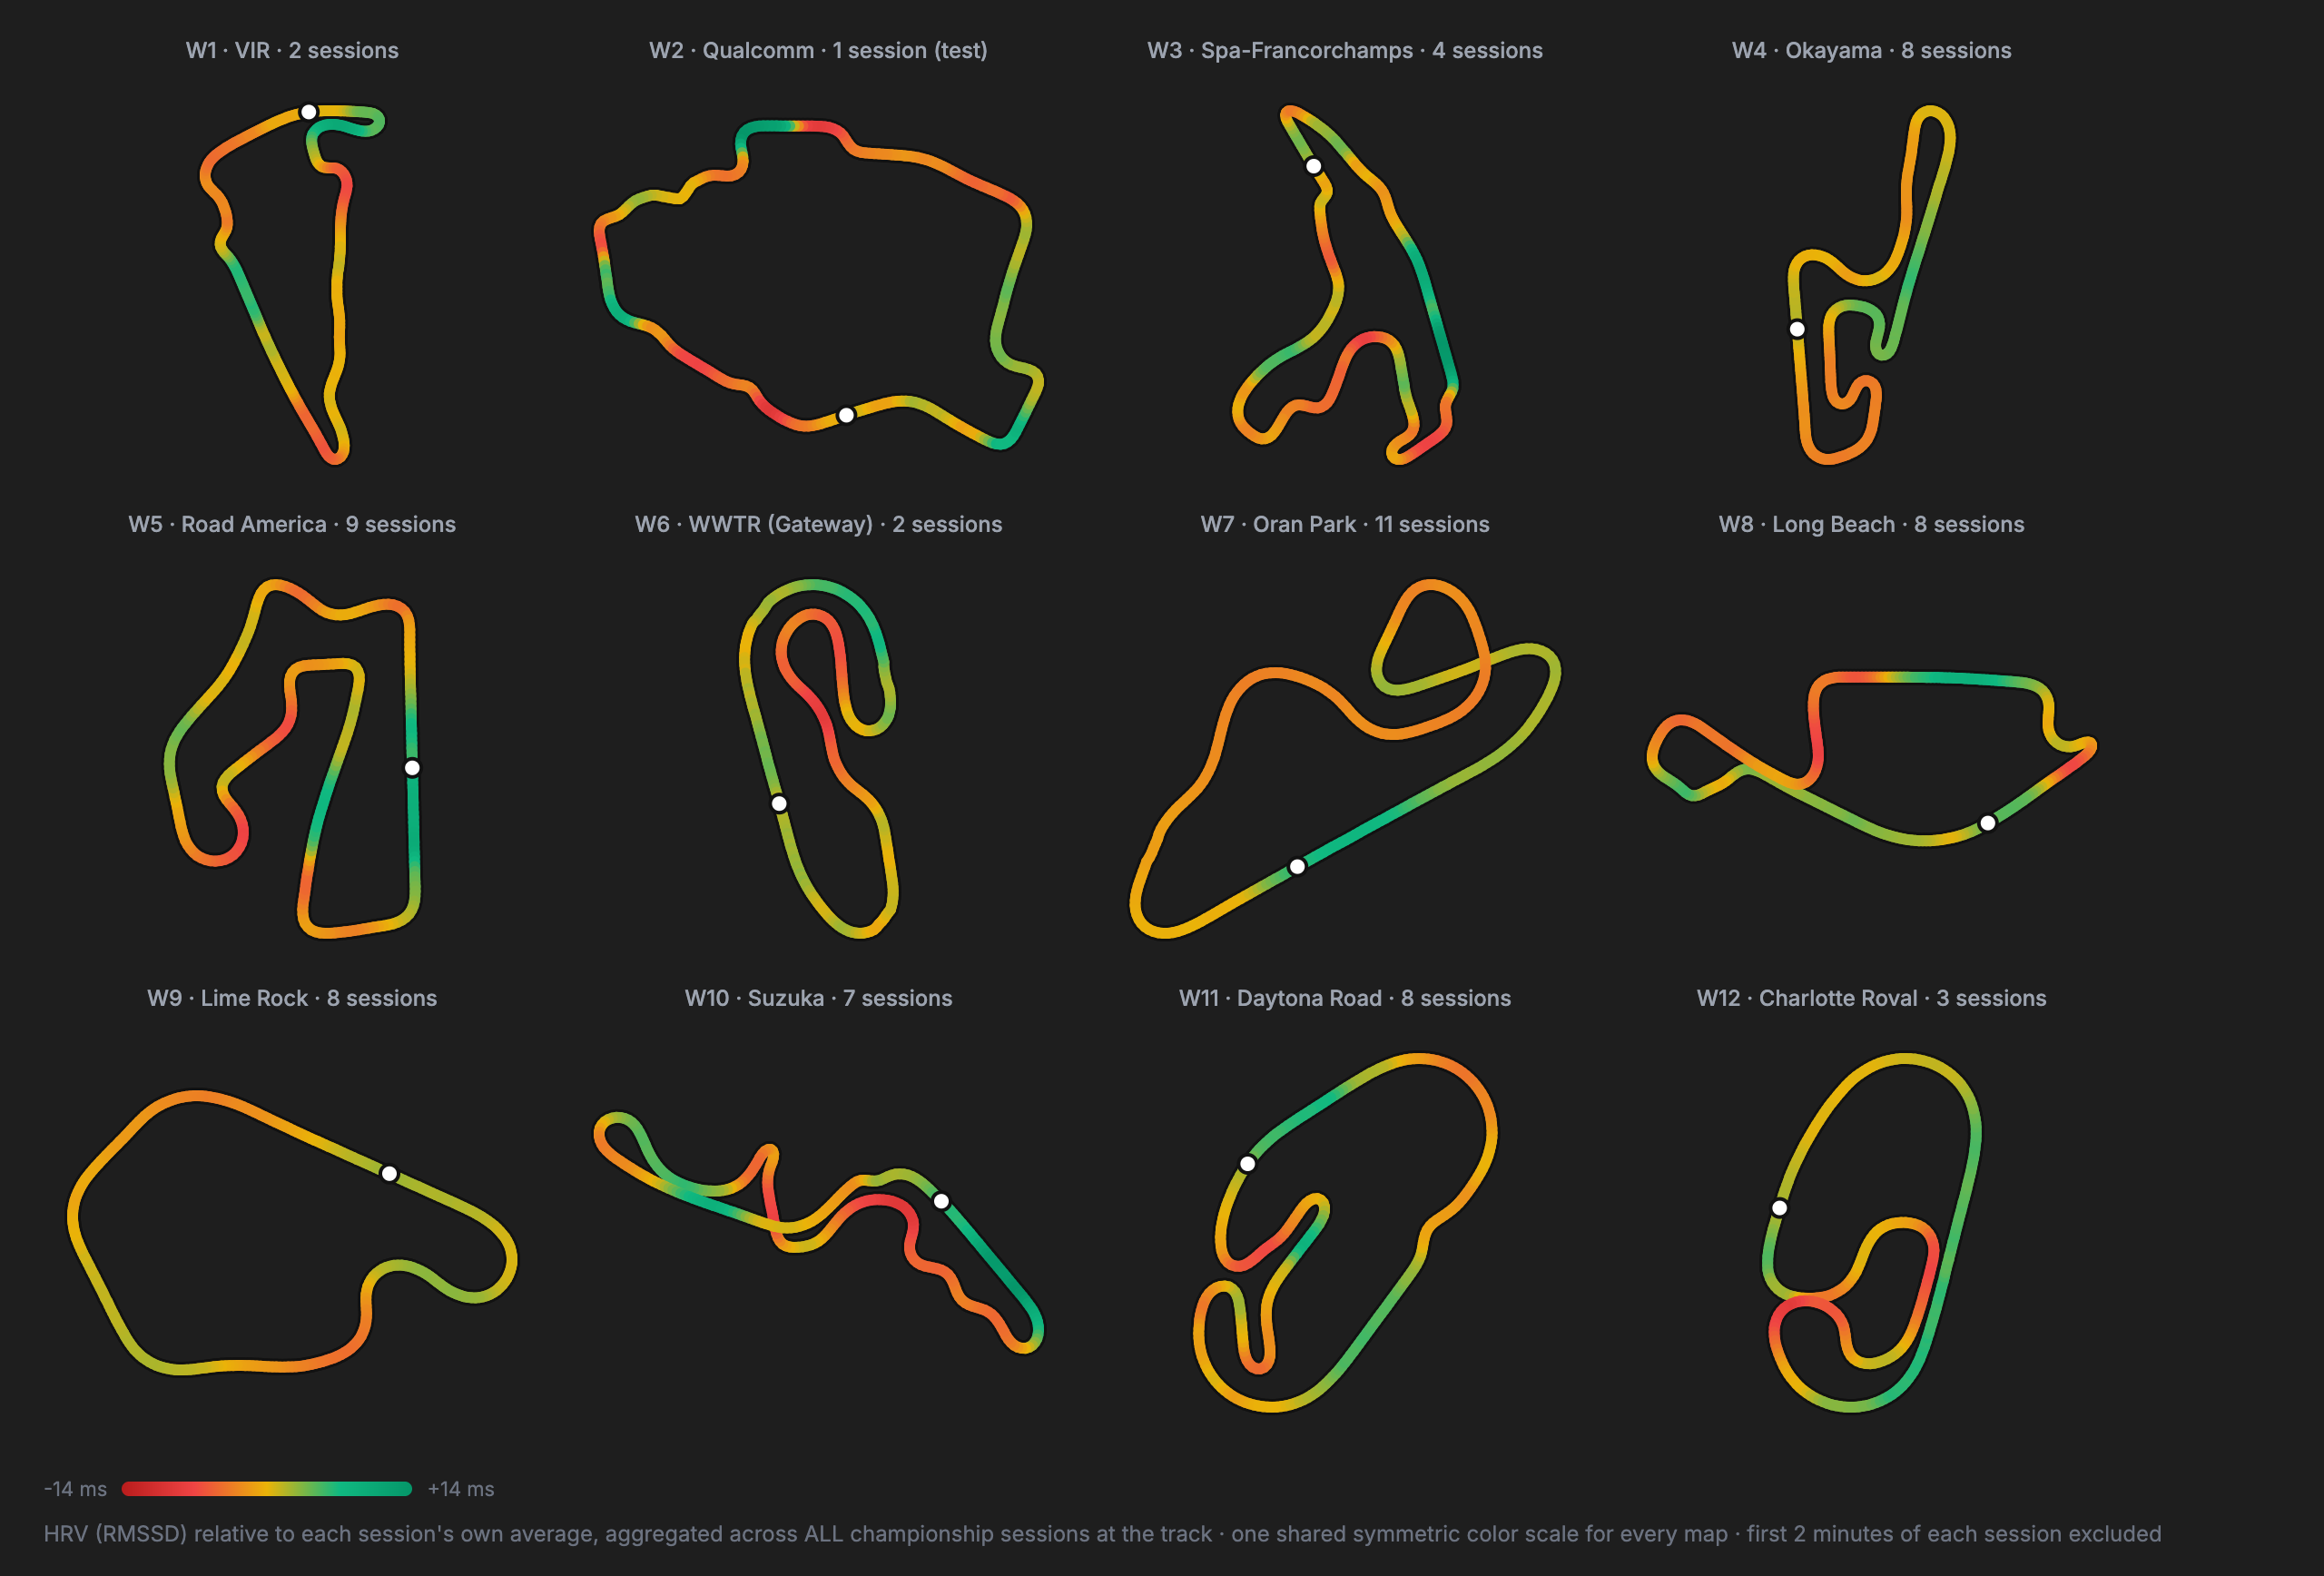
The maps reward a closer look. What's particularly interesting is how they show that heart rate and HRV are related but not simple inverses, exactly as the fight-duration chart also hinted at. Suzuka is a good example. Through the esses you can see both signals moving together – heart rate rising and HRV falling through the whole sequence. But on the heart rate map I look completely calm through 130R, and only get a response into the final chicane. On the HRV map, 130R is clearly a stressor. I cannot prove it from this data, but my guess is a held breath: hold your breath through a fast corner and the breathing-driven part of HRV collapses without the heart rate moving at all, which is precisely what a ten-beat RMSSD would show (and I'm sure in a real car that response through 130R would look a lot more red).
Spa shows the other thing the braking response showed: the delay. Heart rate peaks shortly after the final chicane and the first corner, not in them, and again after Eau Rouge and Raidillon rather than through the climb itself. The hottest sections of the heart rate map are the straights that follow the demanding bits, not the demanding bits themselves.
The same reading works for the F4 calendar.
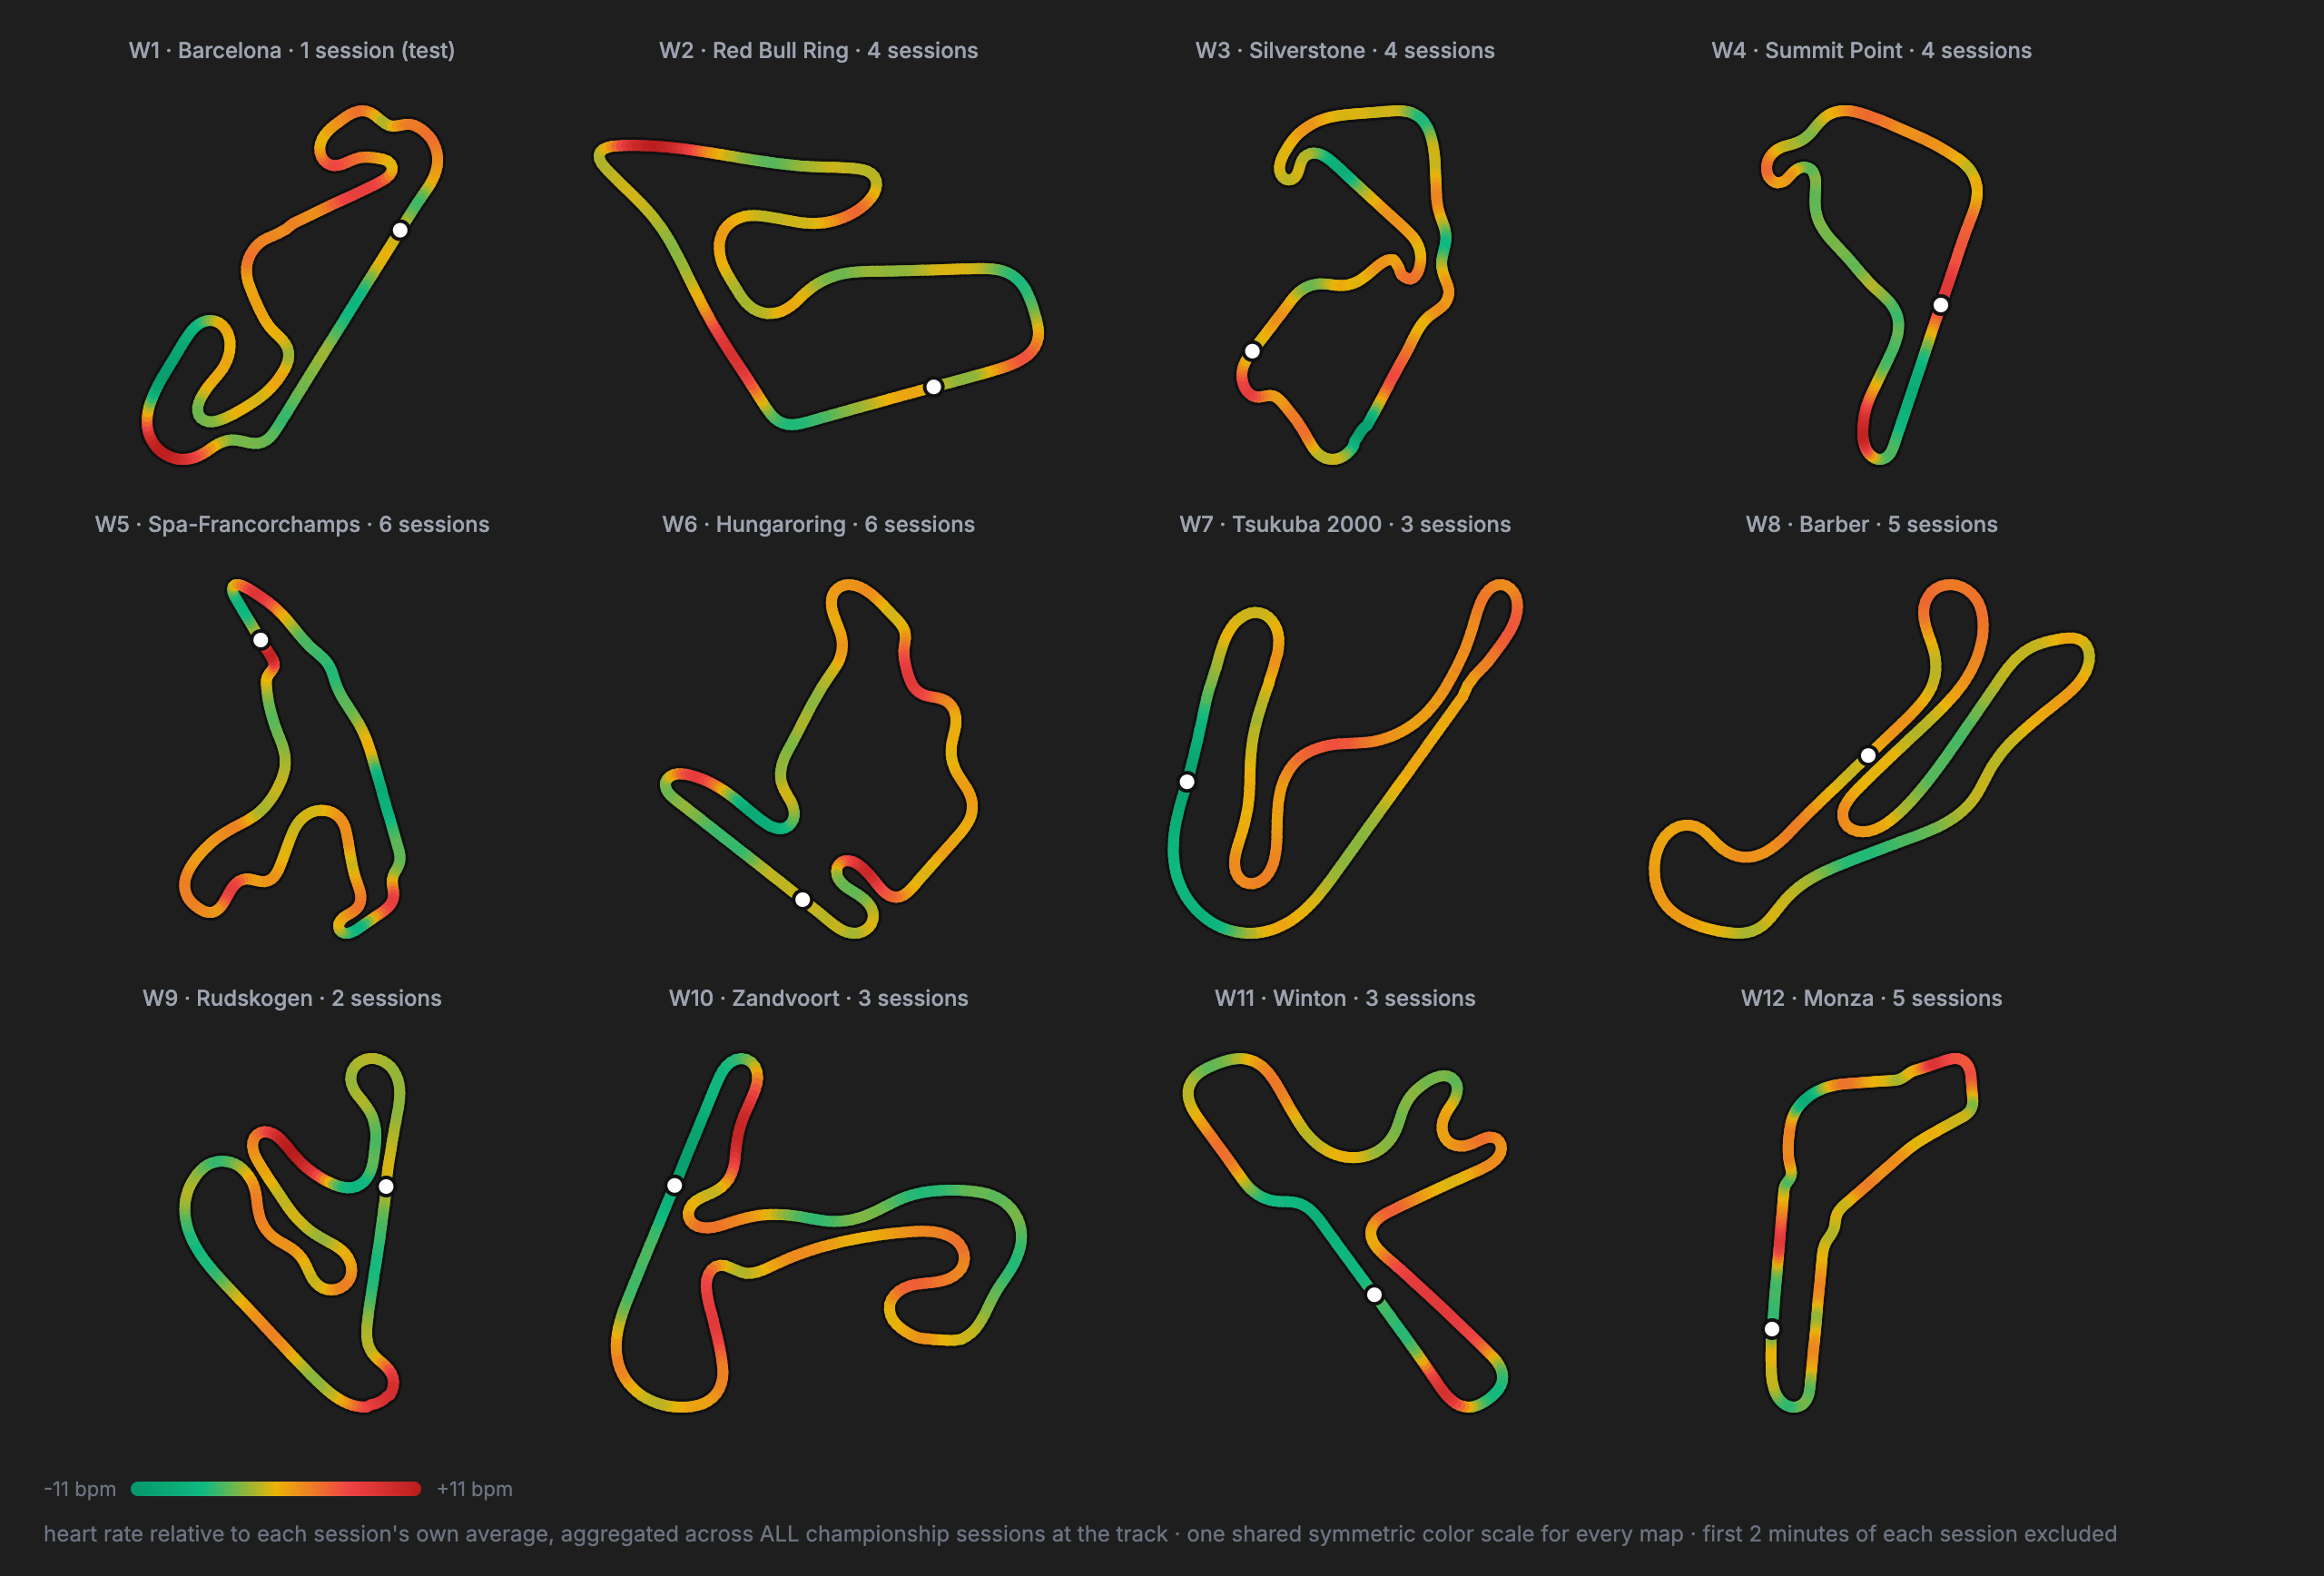
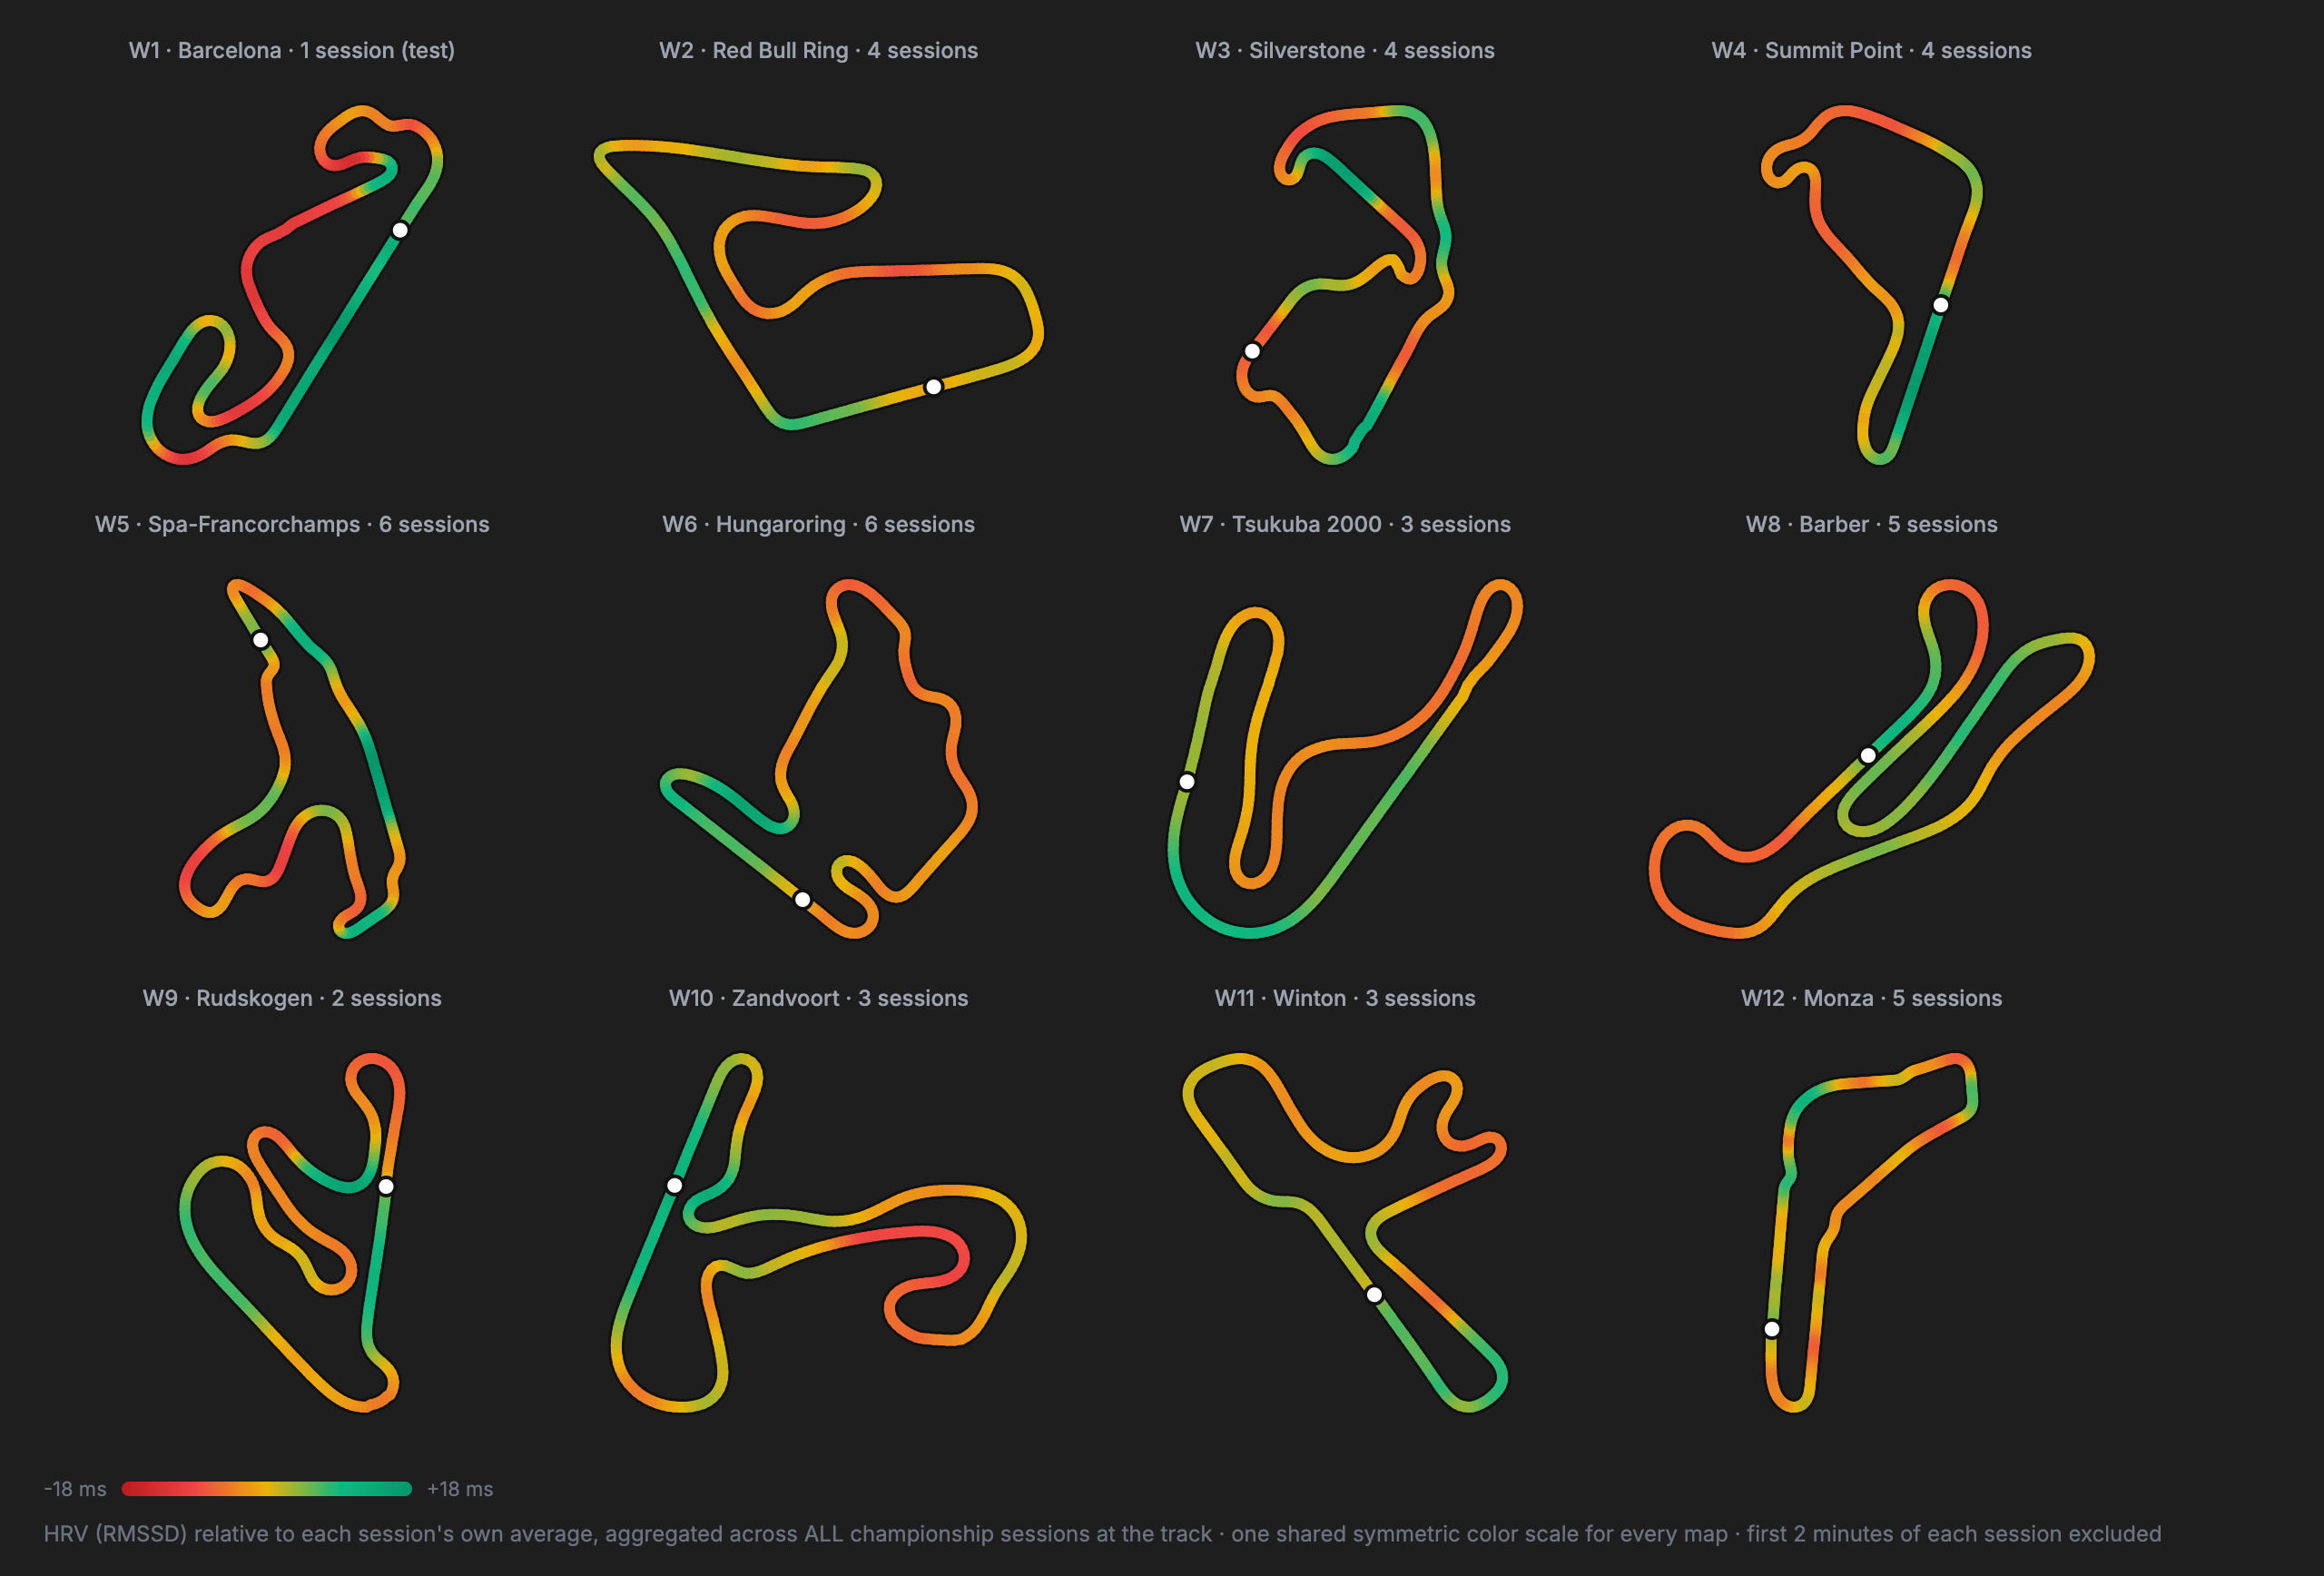
All these heatmaps above include all session data – clean air as well as fights. Monza in the F4 shows the effect of this nicely. There's a heart rate spike before turn one, a result of many close battles down the main straight and hoping no one (including myself) does anything stupid into the chicane.
The season's tracks, ranked
As mentioned, going into this I was hoping I could pull out a clear "most stressful track" of the season, or something like that. The truth is that other things – how close the battles were that week, and above all my daily baseline – make this a really difficult question to answer. But for what it is worth, here are the season's weeks ranked by clean-air heart rate and HRV, with every session at each track shown.
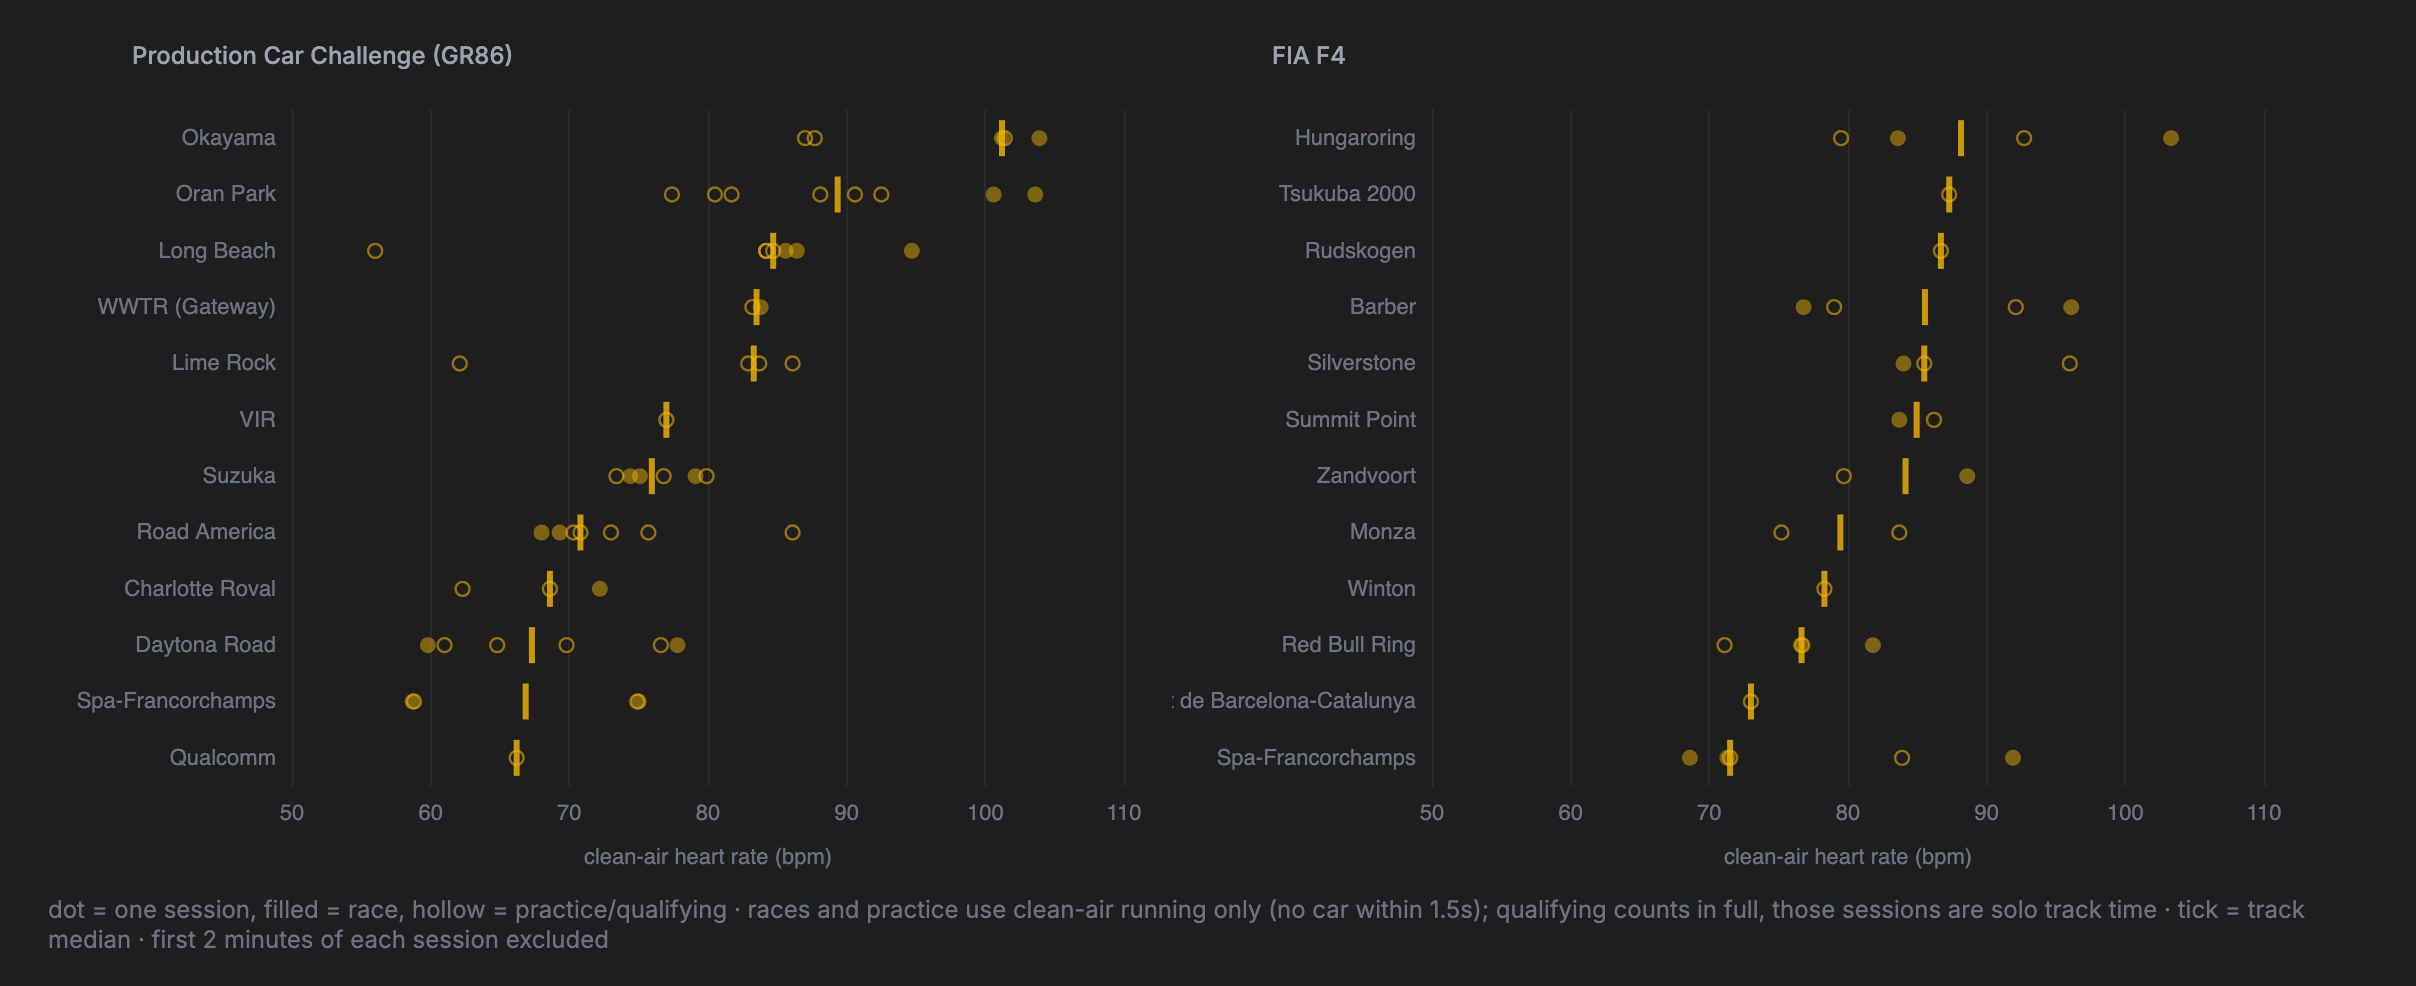
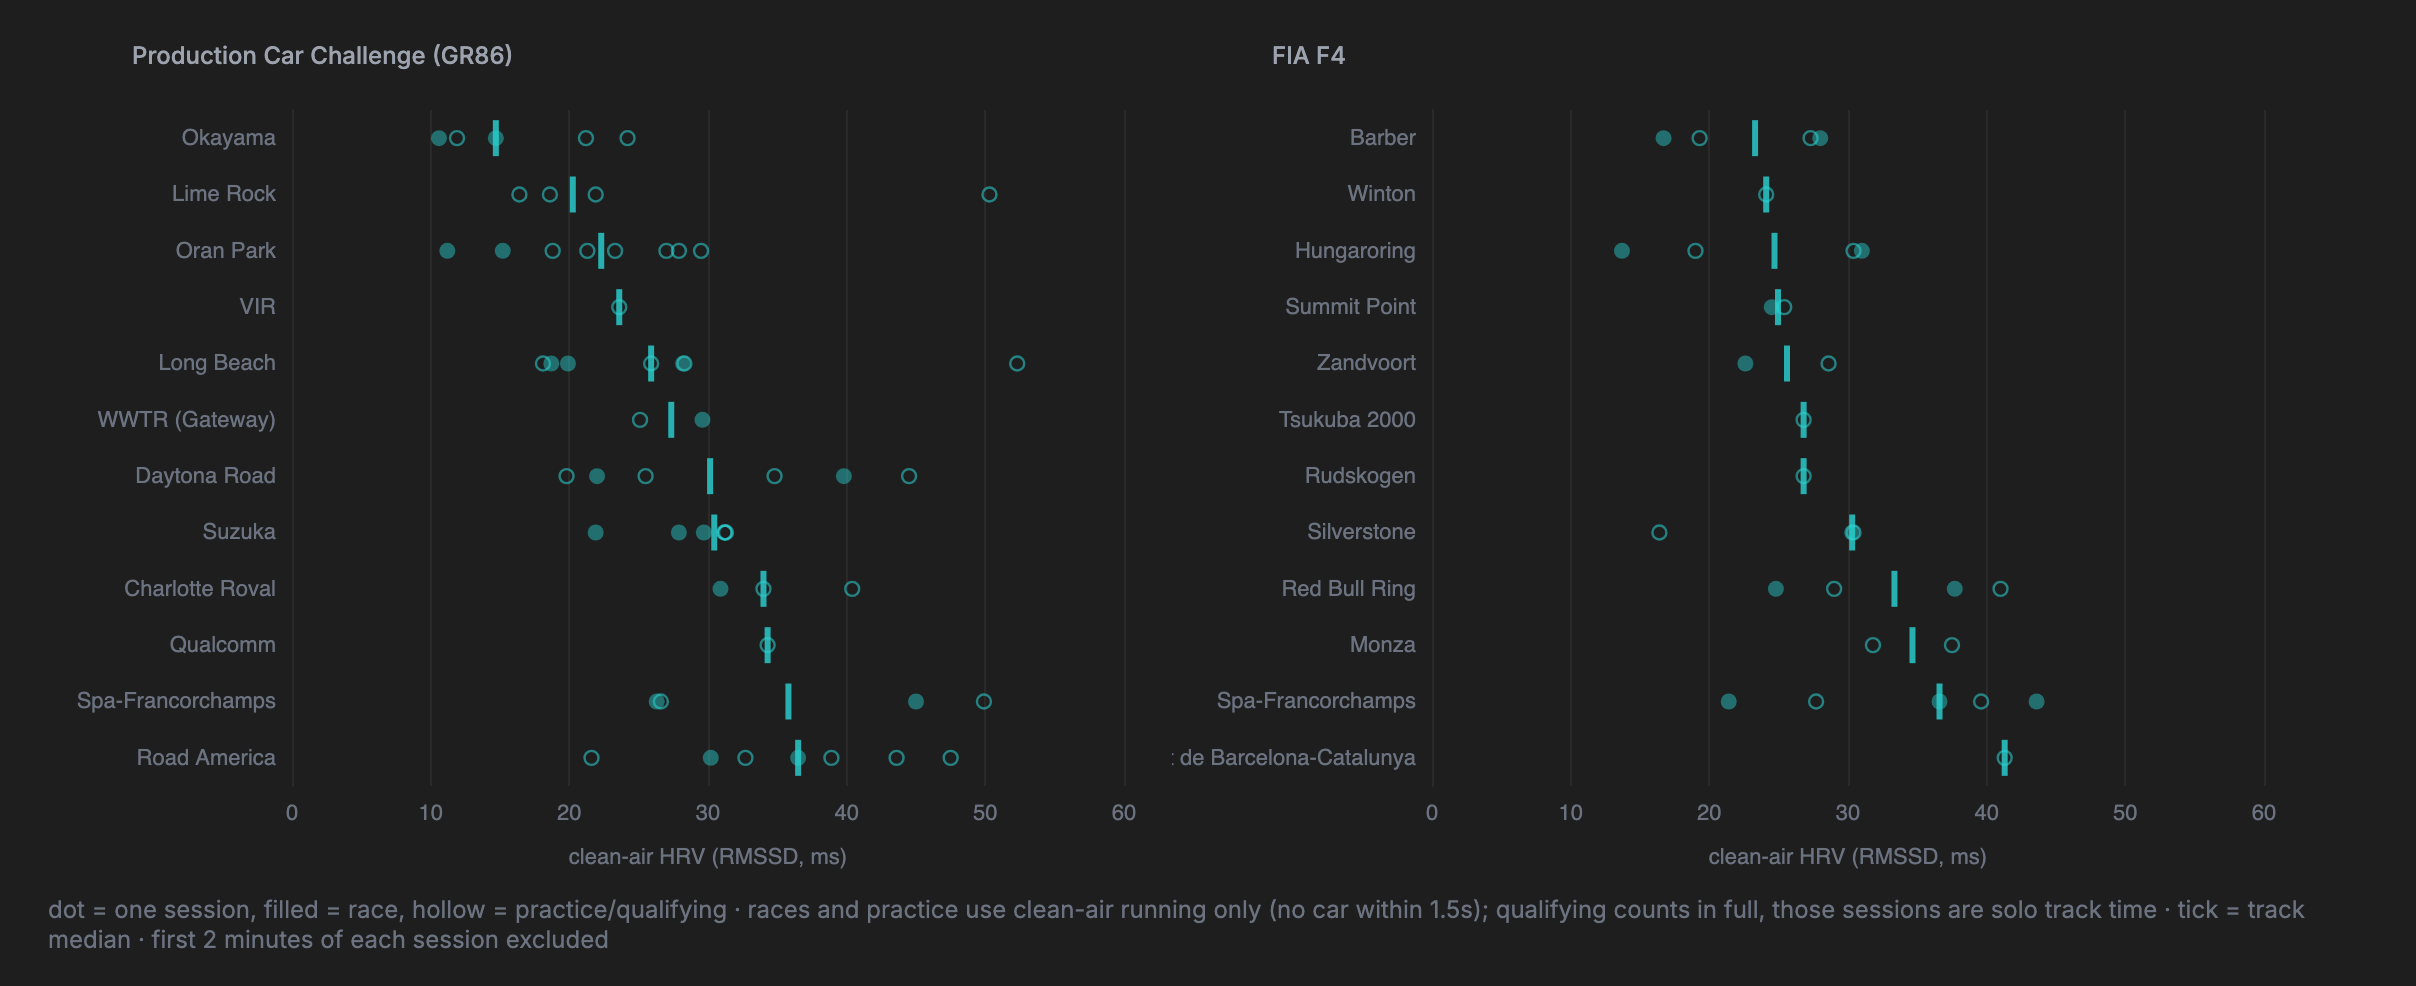
A quick note on the two outliers. Qualcomm in the GR86 and Barcelona in the F4 are the two tracks where I have no usable race data (just me being an idiot and forgetting to record) so each is represented by a single solo test session driven after the season, with nobody to race, just so I could get a full grid of 12 maps. That automatically makes them look like two of the calmest tracks of the season.
Two races
Season medians are one way to look at this. The other is a single race, and two races this season tell two very different stories. Both panels below are ApexFlow's Your Race view: heart rate over the race with fights shaded (blue attacking, red defending, purple boxed in), the position trace, and a timeline of every fight and incident underneath.
Suzuka: a quiet race from the front
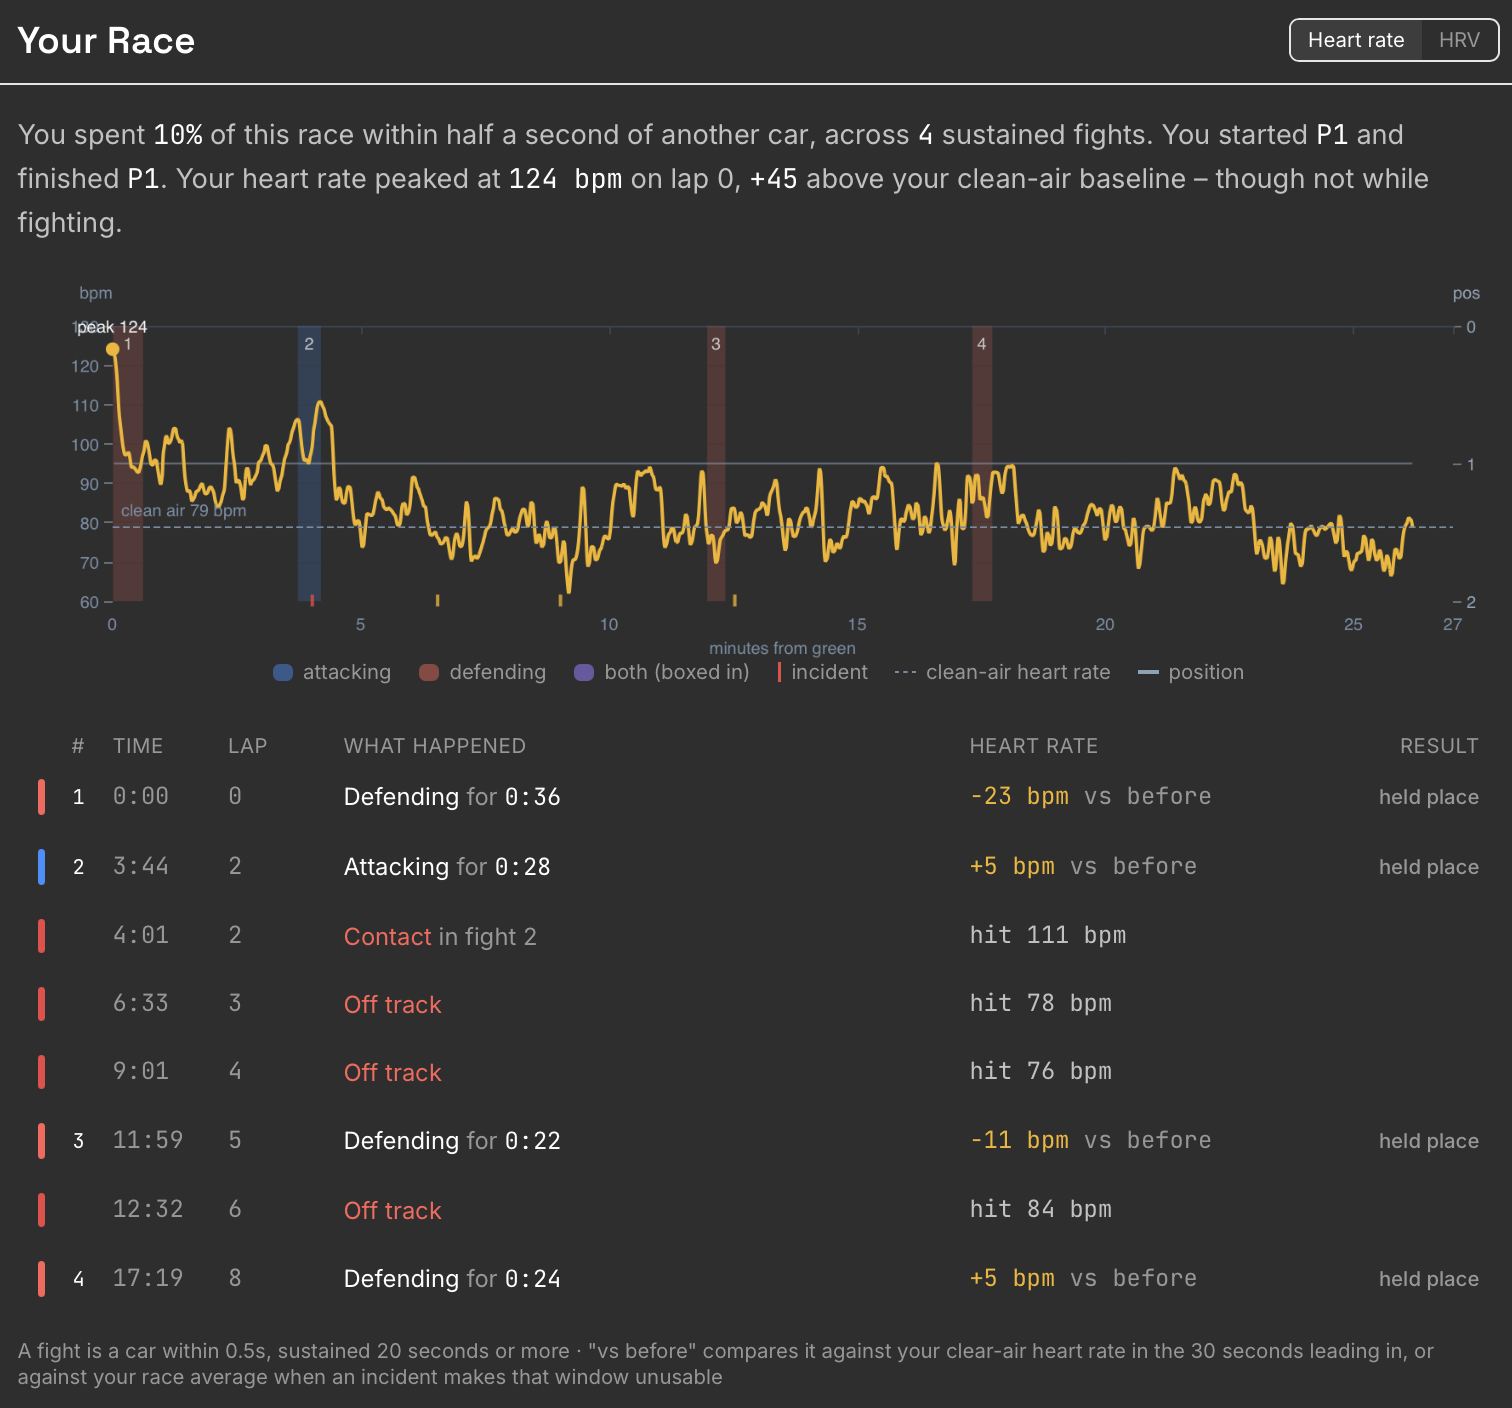
Pole position, led every lap, won. Only ten per cent of the race within half a second of another car, across four brief moments. The first was a short defence off the line. The other three were not really fights for position at all – they were backmarkers and cars coming out of the pits – and you can see that the heart rate barely reacts to them. What it did react to was the start: the peak of the whole race, 124 bpm, came on lap zero, sitting stationary in first place with the best possible view of an empty track, 45 bpm above the race's clean-air level.
Monza: never a moment alone
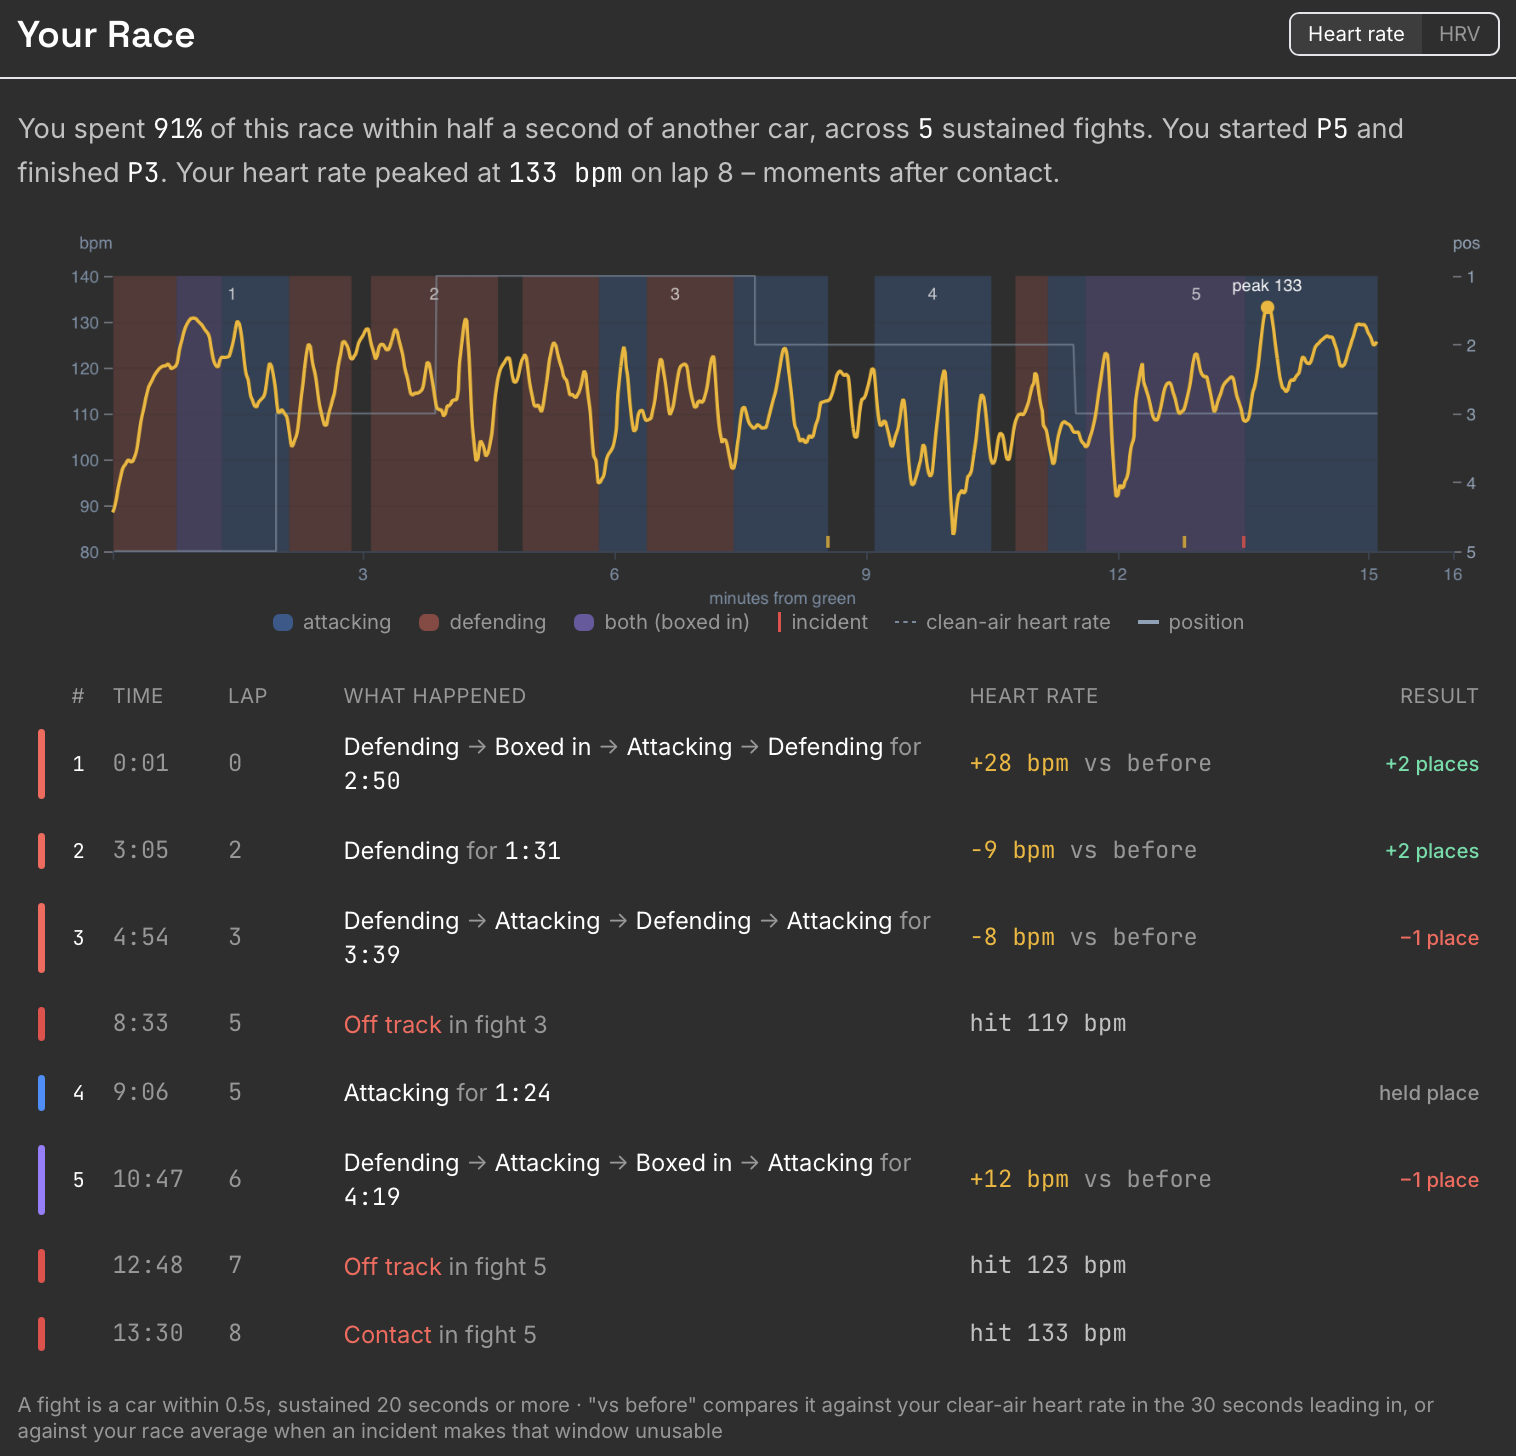
The F4 season finale, and a very different kind of race. Fifth to first then back to third, 91% of the race within half a second of another car, five fights – one of them four minutes and nineteen seconds long – and the state flipping between attacking, defending and boxed in all the way through, with some pretty sketchy moments. There is barely a clean-air stretch in the whole race to compare against. Heart rate sits mostly between 110 and 130 from the first lap to the last, and the peak of 133 bpm came on lap eight, moments after contact. It was also one of the most fun F4 races I had all season – close, hard, and mostly very clean racing (which is rare for both F4 and Monza, and even more so the combination of both).
Thanks to Track Titan's awesome video capture and export features I have a record of exactly what I saw in the moment, with the heart rate, HRV and traffic state from ApexFlow overlaid afterwards for this article.
I'm not sure whether it has any impact on the results, but as you can see from all the shaking, I race in VR, which at least subjectively makes the experience more visceral than it would be on a monitor.
All of this in ApexFlow
Nearly every view in this article is a live feature of ApexFlow: the start curves, the traffic states and fight-duration charts, the braking response, the track heatmaps and the Your Race panels all use exactly the definitions used here. The season-wide pieces – the proximity curves, the ranking of the season's tracks and the twelve-track heatmap grids – I did in a separate analysis on top of the same data, and I will look at bringing some of them into the dashboard.
If you race on iRacing and own a Bluetooth heart rate strap, you can start collecting and analysing your own racing physiology. You can record either with the Yudemon HRV app on your phone and upload the telemetry files on the web afterwards, or with a small Windows desktop app. The Getting Started guide walks through both.
Just to be clear what this is and isn't at this stage. I think everything above is genuinely interesting, and some of it – the proximity curve especially – is more striking than I expected from a season of recording my own data. But I am deliberately not claiming that any of it is actionable yet. The big open question for me, and the one that ties ApexFlow back to the HRV biofeedback side of Yudemon, is whether you can actually train or steer your nervous system to get something out of this: deliberate slow breathing on the grid or on the formation lap, or a few breaths to reset on a long straight after an intense battle or an off-track. Given what the start curves look like, the grid is the obvious place to try. I do not have the answers yet, but that is the direction I will keep investigating and building in. The other direction is out of the sim altogether: real-world telemetry support is in the works, and how much more extreme all of this gets when the g-forces (and stakes) are real is a question I would very much like to answer with my own data.
See you on track, in the sim or the real world.